-
- Trading Platforms
- PU Prime App
- MetaTrader 5
- MetaTrader 4
- PU Copy Trading
- Web Trader
- PU Social
-
- Trading Conditions
- Account Types
- Spreads, Costs & Swaps
- Deposits & Withdrawals
- Fee & Charges
- Trading Hours

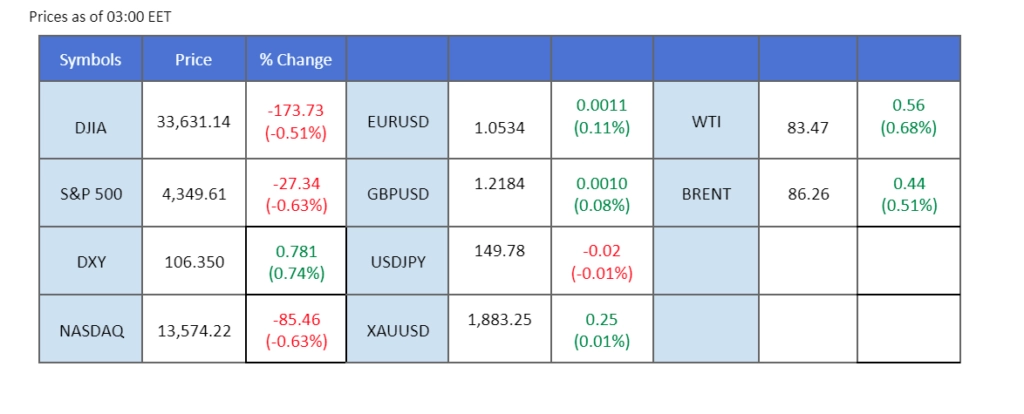
Market sentiments shifted significantly following the release of yesterday’s U.S. Consumer Price Index (CPI) data, which surpassed expectations. Coupled with robust Initial Jobless Claims figures indicating a resilient labour market, investors are reevaluating the possibility of the Federal Reserve’s monetary tightening cycle drawing to a close. The U.S. dollar exhibited substantial strength, marking a more than 0.7% surge in the dollar index, impacting commodities like gold and oil which faced headwinds due to the strengthened dollar. Simultaneously, China continues to grapple with economic recovery, as its Consumer Price Index fell short of market consensus, underscoring ongoing challenges in the Chinese economy.
Current rate hike bets on 1st November Fed interest rate decision:
Source: CME Fedwatch Tool
0 bps (88.0%) VS 25 bps (12%)


The US Dollar staged a significant rally in response to high inflation data, reigniting expectations of rate hikes by the Federal Reserve. A 0.40% increase in the US CPI for September, surpassing economists’ 0.30% forecast, marked a key driver behind this surge. Housing and gasoline costs played pivotal roles in driving up prices, further intensifying discussions about future monetary policy.
The Dollar Index is trading higher while currently testing the resistance level. MACD has illustrated increasing bullish momentum, while RSI is at 64, suggesting the index might extend its gains after breakout since the RSI stays above the midline.
Resistance level: 106.35, 106.90
Support level: 105.65, 105.20
Bullish sentiment in the gold market saw a momentary retreat following the release of high inflation data, as profit-taking took centre stage. The allure of gold, however, remains clouded by uncertainty, as some Federal Reserve members continue to express reluctance regarding rate hikes in November, highlighting the delicate balance between economic factors and policy direction.
Gold prices are trading higher while currently near the resistance level. MACD has illustrated increasing bullish momentum, while RSI is at 48, suggesting the commodity might extend its gains after breakout since the RSI rebounded sharply from oversold territory.
Resistance level: 1885.00, 1950.00
Support level: 1835.00, 1785.00
The euro retreated from its uptrend channel, signalling a potential trend reversal against the strengthening dollar. Yesterday’s release of robust U.S. Consumer Price Index (CPI) data bolstered the dollar, propelling the dollar index up by over 0.7%. The optimistic economic indicators in the U.S. are expected to exert continued pressure on the EUR/USD pair. Simultaneously, the European Central Bank (ECB) faces a delicate balancing act, weighing the risks between rising inflation and potential economic recession.
The EUR/USD pair rejected at the level at 1.0630 and plunged from that resistance level, suggesting a trend reversal. The RSI has eased drastically while the MACD has crossed from the above, suggesting the bullish momentum has vanished.
Resistance level: 1.0630, 1.0700
Support level: 1.0500, 1.0460
The USD/JPY pair is in a pivotal position, hovering near the significant 150 mark. The surge in the robust dollar, fueled by yesterday’s positive Consumer Price Index (CPI) data, has put pressure on the yen. Market sentiment suggests that crossing this level may trigger a defence mechanism from the Bank of Japan (BoJ). The yen is anticipated to remain weak due to Japan’s extended ultra-loose monetary policy while investors grapple with the possibility of another round of interest rate hikes by the Federal Reserve before the end of 2023.
USD/JPY traded sideways near its crucial, pivotal level at 150. The RSI is approaching the overbought zone while the MACD has broken above the zero line, suggesting the bullish momentum is getting stronger.
Resistance level: 150.40, 151.50
Support level: 148.60, 147.50
US equity markets experienced a pullback, primarily due to a resurgence in US Treasury yields that cast a shadow over their appeal, reflecting the complex interplay between bond markets and equity.
The Dow is trading lower while currently near the support level. MACD has illustrated diminishing bullish momentum, while RSI is at 50, suggesting the index might be traded flat since the RSI near the midline.
Resistance level: 34355.00, 34900.00
Support level: 33425.00, 32745.00
The Pound Sterling saw its six-day winning streak against the US Dollar come to an end. This reversal followed better-than-expected economic performance in the United States, which, in turn, raised US 10-year yields. Nevertheless, the UK’s own economic data, as reported by the Office for National Statistics (ONS), painted a picture of a returning economy, recording a 0.20% growth in August after a 0.60% contraction, thus limiting losses for the Pound Sterling.
GBP/USD is trading lower while currently testing the support level. However, MACD has illustrated diminishing bearish momentum, while RSI is at 26, suggesting the pair might experience technical correction since the RSI might enter oversold territory.
Resistance level: 1.2250, 1.2330
Support level: 1.2170, 1.2110
The Australian dollar faced a setback as it failed to sustain its position within a higher consolidation range, slipping notably. The recent surge in the U.S. Consumer Price Index (CPI) data bolstered the dollar, prompting it to trade robustly against major currencies. Market uncertainty looms regarding the Reserve Bank of Australia’s (RBA) upcoming interest rate decision in early November. Australia’s interest rate gap has widened after a four-month rate pause, creating anticipation around the RBA’s next move. Investors keenly await the release of RBA meeting minutes on Monday for insights into the central bank’s monetary policy outlook.
The Aussie dollar has plunged below its price consolidation range, suggesting a trend reversal for the pair. The RSI and the MACD have also declined drastically, suggesting the bullish momentum has vanished.
Resistance level: 0.6370, 0.6470
Support level: 0.6290, 0.6180
A bearish inventory report prompted a decline in oil prices, with the Energy Information Administration (EIA) revealing a significant 10.176-million-barrel increase in US crude oil inventories, far exceeding market expectations. This marked the highest government estimate on crude production, driven in part by increased efficiency in output from US shale oil basins.
Oil prices are trading lower while currently testing the support level. MACD has illustrated increasing bearish momentum, while RSI is at 42, suggesting the commodity might extend its losses after breakout since the RSI stays below the midline.
Resistance level: 94.00, 103.50
Support level: 82.50, 73.35
Step into the world of trading with confidence today. Open a free PU Prime live CFD trading account now to experience real-time market action, or refine your strategies risk-free with our demo account.
This content is for educational and informational purposes only and should not be considered investment advice, a personal recommendation, or an offer to buy or sell any financial instruments.
This material has been prepared without considering any individual investment objectives, financial situations. Any references to past performance of a financial instrument, index, or investment product are not indicative of future results.
PU Prime makes no representation as to the accuracy or completeness of this content and accepts no liability for any loss or damage arising from reliance on the information provided. Trading involves risk, and you should carefully consider your investment objectives and risk tolerance before making any trading decisions. Never invest more than you can afford to lose.

Trade forex, indices, metal, and more at industry-low spreads and lightning-fast execution.
Sign up for a PU Prime Live Account with our hassle-free process.
Effortlessly fund your account with a wide range of channels and accepted currencies.
Access hundreds of instruments under market-leading trading conditions.
Please note the Website is intended for individuals residing in jurisdictions where accessing the Website is permitted by law.
Please note that PU Prime and its affiliated entities are neither established nor operating in your home jurisdiction.
By clicking the "Acknowledge" button, you confirm that you are entering this website solely based on your initiative and not as a result of any specific marketing outreach. You wish to obtain information from this website which is provided on reverse solicitation in accordance with the laws of your home jurisdiction.
Thank You for Your Acknowledgement!
Ten en cuenta que el sitio web está destinado a personas que residen en jurisdicciones donde el acceso al sitio web está permitido por la ley.
Ten en cuenta que PU Prime y sus entidades afiliadas no están establecidas ni operan en tu jurisdicción de origen.
Al hacer clic en el botón "Aceptar", confirmas que estás ingresando a este sitio web por tu propia iniciativa y no como resultado de ningún esfuerzo de marketing específico. Deseas obtener información de este sitio web que se proporciona mediante solicitud inversa de acuerdo con las leyes de tu jurisdicción de origen.
Thank You for Your Acknowledgement!