-
- Trading Platforms
- PU Prime App
- MetaTrader 5
- MetaTrader 4
- PU Copy Trading
- Web Trader
- PU Social
-
- Trading Conditions
- Account Types
- Spreads, Costs & Swaps
- Deposits & Withdrawals
- Fee & Charges
- Trading Hours

The Retail Sales figure disappointed at -0.8%, marking its lowest point since January 2023. This has fueled expectations for a potential rate cut by the Federal Reserve in May.
The much-anticipated U.S. Retail Sales figures failed to sustain positive sentiment following the robust Consumer Price Index (CPI) reading unveiled last Tuesday. Despite a decline in Initial Jobless Claims to 212k from the previous 220k, the Retail Sales figure disappointed at -0.8%, marking its lowest point since January 2023. This has fueled expectations for a potential rate cut by the Federal Reserve in May. Traders are closely monitoring today’s Producer Price Index (PPI) reading to discern the potential direction of the U.S. dollar.
In the commodities sector, both gold and oil prices experienced a significant upswing, attributed to the softening dollar. However, the International Energy Agency’s forecast of slowing demand growth for crude oil this year poses a potential hindrance to further surges in oil prices.
Against the backdrop of mixed U.S. economic data, the heightened risk appetite in the market is evident, as seen in the ongoing rallies in both U.S. equity markets and the Nikkei, the Japanese stock index.
Current rate hike bets on 20th March Fed interest rate decision:
Source: CME Fedwatch Tool
0 bps (89.5%) VS -25 bps (10.5%)

(MT4 System Time)

Source: MQL5

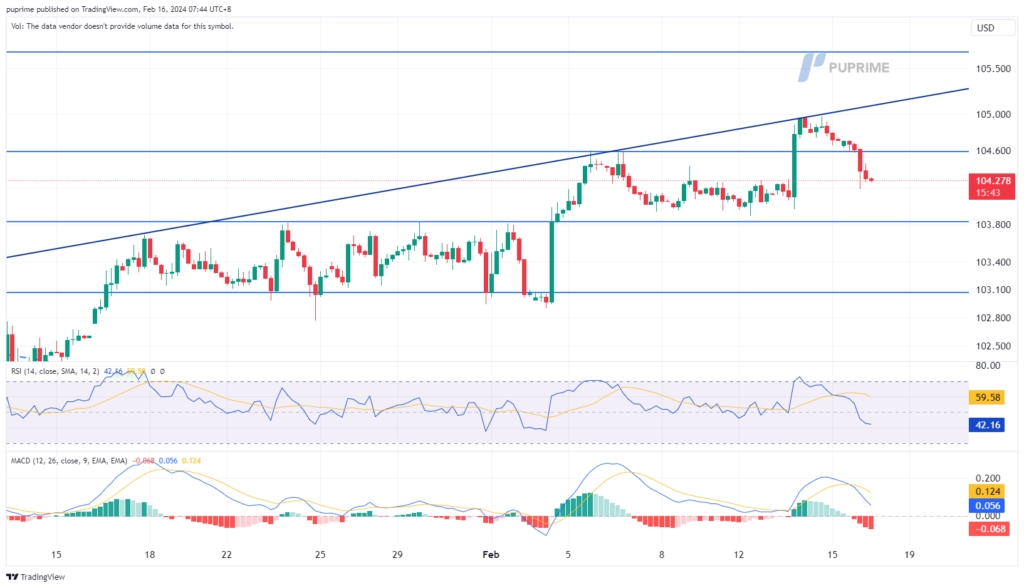
The Dollar Index is encountering headwinds as recent U.S. economic data from last night presents a mixed picture for the market. Retail Sales figures fell short of expectations, contributing to downward pressure on the dollar. However, the Initial Jobless Claims data surpassed expectations, providing some positive momentum. This combination of economic indicators is influencing a downward trajectory for the dollar as market participants await today’s Producer Price Index (PPI) to gain further insights into the currency’s potential direction.
The Dollar Index continues to trade below its uptrend resistance level but remains above the $104 trajectory. The RSI fell to below the 50 level while the MACD is approaching the zero line from above, suggesting that bearish momentum is forming.
Resistance level: 104.60, 105.70
Support level: 103.80, 103.00
Gold prices experienced a notable rebound, propelled by the weakening dollar following lacklustre U.S. Retail Sales figures. Simultaneously, the market is attentively monitoring the evolving situation in the Middle East. Moreover, the upcoming U.S. Producer Price Index (PPI) reading scheduled for today is eagerly awaited, as both geopolitical developments and economic data have the potential to directly influence gold prices.
Gold prices have morning-star candlestick price patterns in a daily time frame, suggesting a trend reversal for gold prices. The RSI rebounded from the oversold zone while the MACD crossed at the bottom and approached the zero line, suggesting bullish momentum is forming.
Resistance level: 2020.20, 2050.80
Support level: 1992.80, 1968.30
The GBP/USD currency pair has rebounded, influenced by lacklustre economic data, and is presently trading within its established price consolidation range. The United Kingdom’s Gross Domestic Product (GDP) figures came in below market expectations, with the Year-on-Year (YoY) data registering at -0.2%. This suggests a contraction in the UK economy. However, despite the economic challenges, the persistent issue of sticky inflation in the UK is expected to lead the Bank of England (BoE) to maintain its monetary tightening policy for an extended period. This commitment to curbing inflation provides support for Sterling, contributing to its buoyancy in the current market environment.
GBPUSD rebounded and remains trading within its price consolidation range; the RSI hovering near the 50 level while the MACD flows closely to the zero line, providing a neutral signal for the pair.
Resistance level: 1.2635, 1.2710
Support level:1.2530, 1.2435
The EUR/USD currency pair rebounded, recording a gain of over 0.4% in the last session, primarily driven by the softening of the U.S. dollar. Despite this rebound, the euro is perceived to be lacking momentum, and traders are adopting a cautious stance, awaiting next week’s release of eurozone Consumer Price Index (CPI) data to assess the strength of the euro. At present, the movements of the EUR/USD pair are heavily reliant on the dynamics of the U.S. dollar.
EUR/USD rebounded from its lowest level since last November but faced strong resistance at 1.0775. The RSI rebounded strongly from the oversold zone while the MACD crossed and is approaching the zero line from below, suggesting a bullish momentum is forming.
Resistance level: 1.0775, 1.0865
Support level: 1.0700, 1.0630
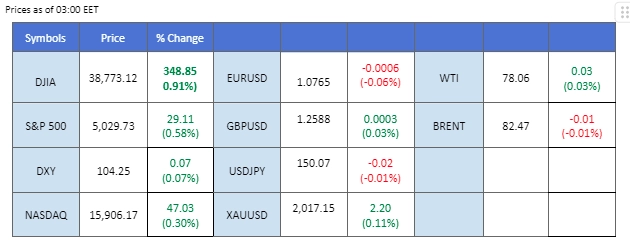
The Dow Jones Index surged by nearly 1% yesterday, gaining 348.85 points and effectively recovering most of the losses incurred after the robust Consumer Price Index (CPI) reading was released on Tuesday. The mixed U.S. economic data, especially the downbeat Retail Sales figure at -0.8%, triggered a shift in market sentiment. This shift, combined with the heightened optimism of a potential rate cut from the Federal Reserve in May, fueled bullish momentum in the equity markets.
The index is approaching its all-time high after posing a significant loss on Tuesday. The RSI continues to flow near the overbought zone while the MACD hovering above the zero line suggests the bullish momentum remains intact with the index.
Resistance level: 39420, 41300
Support level: 37920,36750
The USD/JPY pair has eased from its bullish trend as the strength of the U.S. dollar wanes. On the other hand, the Japanese Yen remains weak, with the latest Gross Domestic Product (GDP) figures falling short of market expectations. This shortfall has cast a shadow on the possibility of the Bank of Japan (BoJ) making a shift in its monetary policy.
The pair remain trading in an uptrend trajectory despite of a minor retrace. The RSI eased from the overbought zone while the MACD crossed on the above, suggesting the bullish momentum has eased slightly.
Resistance level: 151.85, 154.90
Support level: 149.50, 147.60

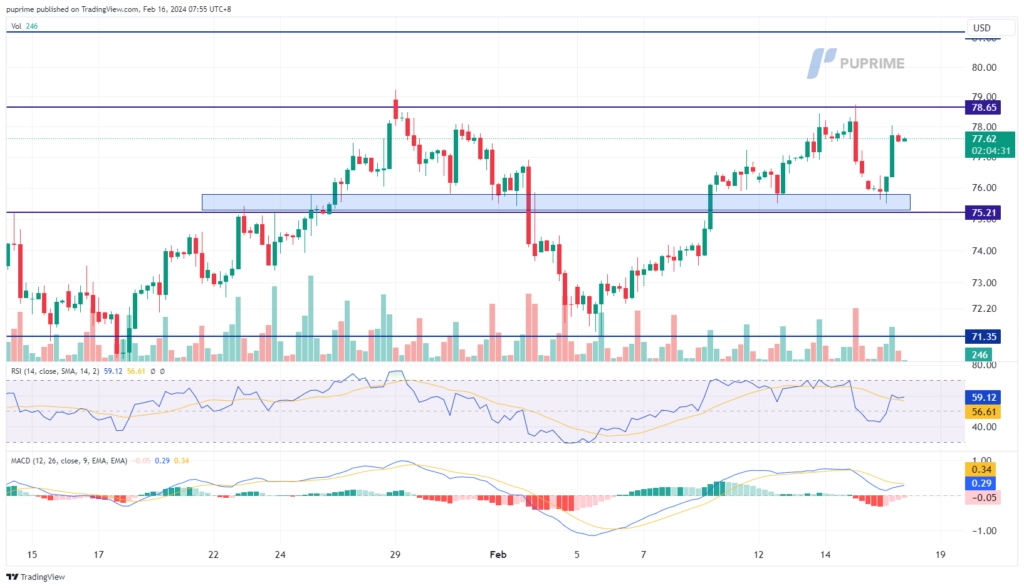
Oil prices have rebounded from above their liquidity zone but are currently below the $79 mark, awaiting a catalyst to break above a formidable resistance level. The recent shift in market sentiment, influenced by moderating U.S. economic data and heightened tensions in the Middle East, has played a pivotal role in propelling oil prices. In the last session, oil prices recorded a gain of more than 1%, highlighting the impact of these combined factors on the commodity’s market dynamics.
Oil prices rose significantly from above its liquidity zone at near the $76 mark, suggesting the bullish momentum remains intact with oil prices. The RSI is hovering near the 50 levels while the MACD is crossing above the zero line, suggesting the oil prices are trading with bullish momentum.
Resistance level: 78.65, 81.20
Support level:75.20, 71.35
Step into the world of trading with confidence today. Open a free PU Prime live CFD trading account now to experience real-time market action, or refine your strategies risk-free with our demo account.
This content is for educational and informational purposes only and should not be considered investment advice, a personal recommendation, or an offer to buy or sell any financial instruments.
This material has been prepared without considering any individual investment objectives, financial situations. Any references to past performance of a financial instrument, index, or investment product are not indicative of future results.
PU Prime makes no representation as to the accuracy or completeness of this content and accepts no liability for any loss or damage arising from reliance on the information provided. Trading involves risk, and you should carefully consider your investment objectives and risk tolerance before making any trading decisions. Never invest more than you can afford to lose.

Trade forex, indices, metal, and more at industry-low spreads and lightning-fast execution.
Sign up for a PU Prime Live Account with our hassle-free process.
Effortlessly fund your account with a wide range of channels and accepted currencies.
Access hundreds of instruments under market-leading trading conditions.
Please note the Website is intended for individuals residing in jurisdictions where accessing the Website is permitted by law.
Please note that PU Prime and its affiliated entities are neither established nor operating in your home jurisdiction.
By clicking the "Acknowledge" button, you confirm that you are entering this website solely based on your initiative and not as a result of any specific marketing outreach. You wish to obtain information from this website which is provided on reverse solicitation in accordance with the laws of your home jurisdiction.
Thank You for Your Acknowledgement!
Ten en cuenta que el sitio web está destinado a personas que residen en jurisdicciones donde el acceso al sitio web está permitido por la ley.
Ten en cuenta que PU Prime y sus entidades afiliadas no están establecidas ni operan en tu jurisdicción de origen.
Al hacer clic en el botón "Aceptar", confirmas que estás ingresando a este sitio web por tu propia iniciativa y no como resultado de ningún esfuerzo de marketing específico. Deseas obtener información de este sitio web que se proporciona mediante solicitud inversa de acuerdo con las leyes de tu jurisdicción de origen.
Thank You for Your Acknowledgement!

The Retail Sales figure disappointed at -0.8%, marking its lowest point since January 2023. This has fueled expectations for a potential rate cut by the Federal Reserve in May.
The much-anticipated U.S. Retail Sales figures failed to sustain positive sentiment following the robust Consumer Price Index (CPI) reading unveiled last Tuesday. Despite a decline in Initial Jobless Claims to 212k from the previous 220k, the Retail Sales figure disappointed at -0.8%, marking its lowest point since January 2023. This has fueled expectations for a potential rate cut by the Federal Reserve in May. Traders are closely monitoring today’s Producer Price Index (PPI) reading to discern the potential direction of the U.S. dollar.
In the commodities sector, both gold and oil prices experienced a significant upswing, attributed to the softening dollar. However, the International Energy Agency’s forecast of slowing demand growth for crude oil this year poses a potential hindrance to further surges in oil prices.
Against the backdrop of mixed U.S. economic data, the heightened risk appetite in the market is evident, as seen in the ongoing rallies in both U.S. equity markets and the Nikkei, the Japanese stock index.
Current rate hike bets on 20th March Fed interest rate decision:
Source: CME Fedwatch Tool
0 bps (89.5%) VS -25 bps (10.5%)

(MT4 System Time)

Source: MQL5

The Dollar Index is encountering headwinds as recent U.S. economic data from last night presents a mixed picture for the market. Retail Sales figures fell short of expectations, contributing to downward pressure on the dollar. However, the Initial Jobless Claims data surpassed expectations, providing some positive momentum. This combination of economic indicators is influencing a downward trajectory for the dollar as market participants await today’s Producer Price Index (PPI) to gain further insights into the currency’s potential direction.
The Dollar Index continues to trade below its uptrend resistance level but remains above the $104 trajectory. The RSI fell to below the 50 level while the MACD is approaching the zero line from above, suggesting that bearish momentum is forming.
Resistance level: 104.60, 105.70
Support level: 103.80, 103.00
Gold prices experienced a notable rebound, propelled by the weakening dollar following lacklustre U.S. Retail Sales figures. Simultaneously, the market is attentively monitoring the evolving situation in the Middle East. Moreover, the upcoming U.S. Producer Price Index (PPI) reading scheduled for today is eagerly awaited, as both geopolitical developments and economic data have the potential to directly influence gold prices.
Gold prices have morning-star candlestick price patterns in a daily time frame, suggesting a trend reversal for gold prices. The RSI rebounded from the oversold zone while the MACD crossed at the bottom and approached the zero line, suggesting bullish momentum is forming.
Resistance level: 2020.20, 2050.80
Support level: 1992.80, 1968.30
The GBP/USD currency pair has rebounded, influenced by lacklustre economic data, and is presently trading within its established price consolidation range. The United Kingdom’s Gross Domestic Product (GDP) figures came in below market expectations, with the Year-on-Year (YoY) data registering at -0.2%. This suggests a contraction in the UK economy. However, despite the economic challenges, the persistent issue of sticky inflation in the UK is expected to lead the Bank of England (BoE) to maintain its monetary tightening policy for an extended period. This commitment to curbing inflation provides support for Sterling, contributing to its buoyancy in the current market environment.
GBPUSD rebounded and remains trading within its price consolidation range; the RSI hovering near the 50 level while the MACD flows closely to the zero line, providing a neutral signal for the pair.
Resistance level: 1.2635, 1.2710
Support level:1.2530, 1.2435
The EUR/USD currency pair rebounded, recording a gain of over 0.4% in the last session, primarily driven by the softening of the U.S. dollar. Despite this rebound, the euro is perceived to be lacking momentum, and traders are adopting a cautious stance, awaiting next week’s release of eurozone Consumer Price Index (CPI) data to assess the strength of the euro. At present, the movements of the EUR/USD pair are heavily reliant on the dynamics of the U.S. dollar.
EUR/USD rebounded from its lowest level since last November but faced strong resistance at 1.0775. The RSI rebounded strongly from the oversold zone while the MACD crossed and is approaching the zero line from below, suggesting a bullish momentum is forming.
Resistance level: 1.0775, 1.0865
Support level: 1.0700, 1.0630
The Dow Jones Index surged by nearly 1% yesterday, gaining 348.85 points and effectively recovering most of the losses incurred after the robust Consumer Price Index (CPI) reading was released on Tuesday. The mixed U.S. economic data, especially the downbeat Retail Sales figure at -0.8%, triggered a shift in market sentiment. This shift, combined with the heightened optimism of a potential rate cut from the Federal Reserve in May, fueled bullish momentum in the equity markets.
The index is approaching its all-time high after posing a significant loss on Tuesday. The RSI continues to flow near the overbought zone while the MACD hovering above the zero line suggests the bullish momentum remains intact with the index.
Resistance level: 39420, 41300
Support level: 37920,36750
The USD/JPY pair has eased from its bullish trend as the strength of the U.S. dollar wanes. On the other hand, the Japanese Yen remains weak, with the latest Gross Domestic Product (GDP) figures falling short of market expectations. This shortfall has cast a shadow on the possibility of the Bank of Japan (BoJ) making a shift in its monetary policy.
The pair remain trading in an uptrend trajectory despite of a minor retrace. The RSI eased from the overbought zone while the MACD crossed on the above, suggesting the bullish momentum has eased slightly.
Resistance level: 151.85, 154.90
Support level: 149.50, 147.60

Oil prices have rebounded from above their liquidity zone but are currently below the $79 mark, awaiting a catalyst to break above a formidable resistance level. The recent shift in market sentiment, influenced by moderating U.S. economic data and heightened tensions in the Middle East, has played a pivotal role in propelling oil prices. In the last session, oil prices recorded a gain of more than 1%, highlighting the impact of these combined factors on the commodity’s market dynamics.
Oil prices rose significantly from above its liquidity zone at near the $76 mark, suggesting the bullish momentum remains intact with oil prices. The RSI is hovering near the 50 levels while the MACD is crossing above the zero line, suggesting the oil prices are trading with bullish momentum.
Resistance level: 78.65, 81.20
Support level:75.20, 71.35

Trade forex, indices, metal, and more at industry-low spreads and lightning-fast execution.
Sign up for a PU Prime Live Account with our hassle-free process.
Effortlessly fund your account with a wide range of channels and accepted currencies.
Access hundreds of instruments under market-leading trading conditions.
Sign up for a PU Prime Live Account with our hassle-free process.
Effortlessly fund your account with a wide range of channels and accepted currencies.
Access hundreds of instruments under market-leading trading conditions.