


-
- Trading Platforms
- PU Prime App
- MetaTrader 5
- MetaTrader 4
- PU Copy Trading
- Web Trader
- PU Social
-
- Trading Conditions
- Account Types
- Spreads, Costs & Swaps
- Deposits & Withdrawals
- Fee & Charges
- Trading Hours


EN
20 February 2025,08:11
AdvancedTechnical Analysis
20 February 2025, 08:11

The spinning top candlestick pattern is a powerful indicator in technical analysis, offering traders a window into the ongoing battle between buyers and sellers in the market. Its unique structure and implications provide valuable insights into market sentiment, particularly during periods of indecision. Recognising this pattern can help traders anticipate potential reversals or continuations, equipping them with a deeper understanding of price dynamics.
Understanding the spinning top pattern enhances decision-making by helping traders identify shifts in momentum and gauge the balance of power between bulls and bears. This knowledge is relevant for short-term strategies and long-term trend analysis, making it a versatile tool across forex, stocks, commodities, and indices. By mastering this candlestick formation, traders can improve their ability to navigate market volatility and align their strategies with prevailing trends.
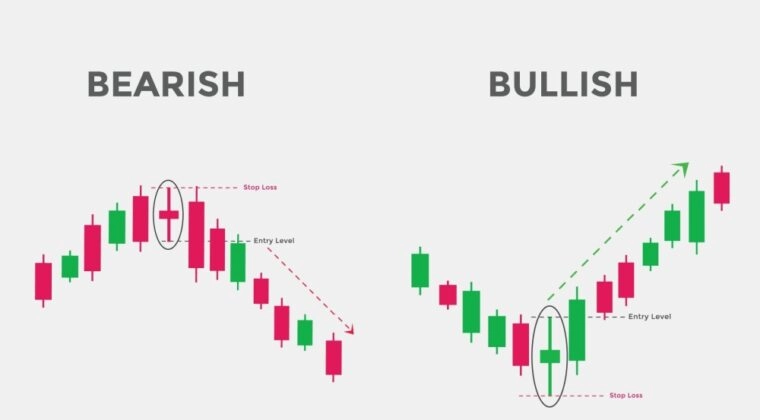
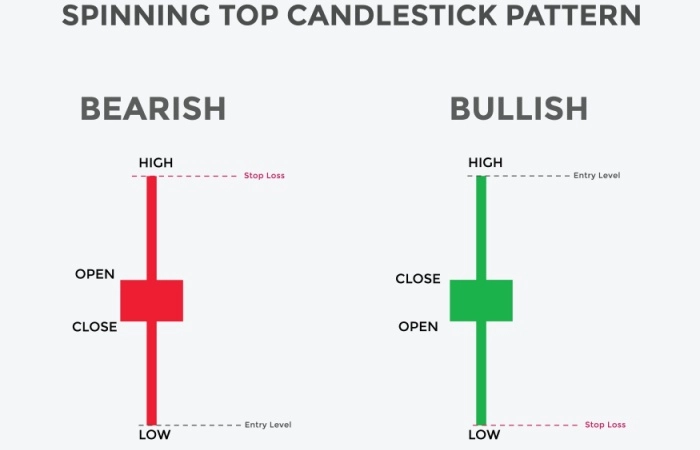
A spinning top is a candlestick pattern that reflects indecision in the market, where neither buyers nor sellers hold a decisive advantage. It is characterised by a small real body located between two long shadows, which indicate significant price movement in both directions during a given trading period.
This pattern typically forms when the opening and closing prices are close to one another, highlighting that while the price was pushed higher and lower during the session, neither side succeeded in establishing control. The spinning top often signals a pause or potential reversal in the current trend, making it a valuable tool for analysing shifts in market sentiment.
The spinning top’s role is essential in identifying moments of equilibrium in a market driven by competing forces. When found at the end of a strong uptrend or downtrend, it suggests that momentum may be weakening, potentially leading to a reversal or a period of consolidation.
The defining feature of a spinning top is its small real body, which reflects minimal difference between the opening and closing prices. This indicates a lack of clear dominance between buyers and sellers during the trading session.
The spinning top features long upper and lower shadows extending from the real body. These shadows reveal significant price movement in both upward and downward directions, highlighting the struggle between bulls and bears. Ideally, the shadows are of similar length.
The context of the spinning top within the market trend is crucial:
The candles preceding and following the spinning top provide important context. A strong reversal candle after the spinning top suggests a potential shift in direction, while a continuation candle signals that the existing trend may persist.
To confirm the significance of a spinning top, traders often use technical tools such as moving averages, RSI, or Bollinger Bands. These indicators help validate the pattern’s implications and provide additional insights into market conditions.
By combining these observations, traders can accurately identify spinning tops and better understand their role in reflecting market sentiment and potential trend changes.
A spinning top is easily recognisable by its small real body and long, balanced shadows, which reflect significant price movement and indecision. Its position within the trend (whether an uptrend, downtrend, or sideways market) provides crucial context for understanding its implications. To confirm its significance, traders should analyse the surrounding candlesticks and use technical indicators for additional validation. Spinning tops serve as a signal of potential pauses or reversals in market momentum.
Spinning tops can appear in two forms: bullish or bearish, depending on the relationship between the opening and closing prices. While both variations share the same core characteristics, they carry different implications depending on their position within the trend.
A bullish spinning top occurs when the closing price is slightly higher than the opening price, resulting in a green or white candle. While it indicates market indecision, its slightly bullish nature suggests a potential reversal or continuation of upward momentum if it appears in specific contexts:
A bearish spinning top forms when the closing price is marginally lower than the opening price, creating a red or black candle. Its slightly bearish sentiment often implies the following:
While the colour of the spinning top provides subtle hints about market sentiment, its overall message remains neutral unless validated by the next candlestick. Traders should focus on the pattern’s position within the trend and combine it with other tools, such as support and resistance levels or technical indicators, to make informed decisions.
Bullish spinning tops close slightly higher than their opening price, hinting at potential upward reversals or trend continuations, especially when found at the end of a downtrend. Bearish spinning tops close slightly lower, signalling potential downward reversals or pauses in an uptrend. Despite these subtle differences, both patterns are neutral on their own and require confirmation from the next candlestick and additional technical analysis to validate their implications.
The spinning top candlestick pattern is a visual representation of market indecision, providing critical insights into trader sentiment and the balance of power between buyers and sellers. Its significance lies in its ability to signal potential turning points in the market or moments of equilibrium during ongoing trends.
Reflecting Market Indecision
A spinning top forms when buyers push prices higher during a session, and sellers counteract by driving prices lower, ultimately resulting in a close near the opening price. This back-and-forth struggle illustrates a lack of clear direction, making the spinning top a key indicator of uncertainty in market sentiment.
Identifying Trend Exhaustion
When a spinning top appears at the end of a strong uptrend or downtrend, it often signals that the prevailing momentum is weakening. In an uptrend, it may suggest that bullish control is fading, paving the way for a potential reversal. Conversely, in a downtrend, it can indicate that selling pressure is losing steam, creating an opportunity for buyers to take over.
Providing Context in Consolidation
In a sideways or range-bound market, spinning tops serve to confirm ongoing indecision, indicating that the market lacks a dominant force to drive prices decisively in either direction. This can help traders anticipate continued consolidation within the range.
Signalling Potential Reversals
The significance of a spinning top is magnified when confirmed by subsequent candlesticks.
For example:
The spinning top’s role as a versatile indicator makes it an essential tool for traders seeking to understand market sentiment and anticipate changes in momentum. By interpreting its context and confirming its implications with additional analysis, traders can align their strategies with evolving market dynamics.
The spinning top candlestick pattern is a valuable tool for traders seeking to identify potential market reversals or periods of consolidation. However, its effectiveness lies in how it is incorporated into a broader trading strategy, often supported by technical analysis and risk management techniques.
Incorporating Spinning Tops into Trading Strategies
Spinning tops are most effective when combined with other tools and contextual analysis. Such as:
Confirming the Pattern
Confirmation is essential when using spinning tops to guide trading decisions. This involves analysing the subsequent candlesticks:
Complementary Indicators
Technical indicators enhance the reliability of spinning tops as trading signals. Commonly used indicators include:
Risk Management
Given the neutral nature of spinning tops, effective risk management is crucial. Strategies include:
For traders looking to refine their skills, a demo account offers a risk-free environment to practice identifying spinning tops and integrating them into a trading strategy. This helps build confidence and precision in real-world applications.
By using spinning tops in conjunction with other analytical tools and disciplined risk management, traders can enhance their ability to make informed decisions and navigate market movements effectively.
While the spinning top candlestick pattern is a valuable tool, traders often make mistakes that can lead to ineffective or risky decisions. Understanding these common errors can help you approach this pattern more strategically and avoid unnecessary losses.
1. Acting Without Confirmation
One of the most frequent mistakes is entering a trade based solely on the spinning top without waiting for confirmation from the next candlestick. The spinning top reflects indecision, and without follow-up price action to clarify the market’s direction, it may lead to false signals.
2. Ignoring Market Context
The effectiveness of a spinning top heavily depends on its position within the trend. Traders often misinterpret spinning tops that appear during a sideways market or consolidation phase, mistaking them for reversal signals. Always evaluate the broader market trend and surrounding candlesticks before making a decision.
3. Overlooking Technical Indicators
Relying solely on the spinning top without incorporating technical indicators such as RSI or moving averages can result in poor analysis. These tools help validate the pattern and provide a clearer picture of market sentiment, improving the accuracy of your trades.
4. Poor Risk Management
The long shadows of a spinning top can make placing stop-loss orders challenging. Traders who neglect proper risk management may set stops too close, leading to premature exits, or too far, resulting in disproportionate risk-to-reward ratios. Always assess the shadow lengths and adjust your position size accordingly.
5. Overtrading Based on Spinning Tops
Because spinning tops are a common pattern, overtrading can occur if traders treat every spinning top as a significant signal. It’s essential to prioritise quality over quantity by focusing on spinning tops that form near key support or resistance levels or within strong trends.
While the spinning top candlestick pattern provides valuable insights into market sentiment, it is not without its limitations. Understanding these constraints is essential for traders to avoid over-reliance on the pattern and to use it effectively within a broader trading strategy.
Frequent Occurrence
Spinning tops are a common candlestick pattern, often appearing during periods of consolidation or low volatility. This prevalence can make it challenging to distinguish meaningful signals from inconsequential patterns. Without additional confirmation, spinning tops alone may not provide reliable trading insights.
Neutral Nature
The neutral character of the spinning top means it reflects indecision rather than a definitive market direction. Traders must rely on subsequent candlesticks or complementary analysis tools to interpret its implications, as it does not inherently indicate whether the trend will reverse or continue.
High Risk of False Signals
When used in isolation, spinning tops can produce false signals, particularly in volatile markets. For example, a spinning top might appear to signal a reversal, but the market may instead resume its previous trend. This unpredictability highlights the importance of context and confirmation.
Risk Management Challenges
The large range between the shadows of a spinning top can make stop-loss placement tricky, potentially increasing the risk-to-reward ratio. This is particularly relevant when the shadows are disproportionately long relative to the body, creating larger areas of price fluctuation.
Lack of Price Targets
Spinning tops do not provide specific price targets or exit points, requiring traders to integrate them with other candlestick patterns or technical indicators to establish a complete trading plan. This limitation underscores the need for a holistic approach to trading.
By recognising the limitations of spinning tops and combining them with other analytical tools, traders can mitigate risks and improve the accuracy of their market predictions. This balanced approach ensures that spinning tops are used effectively as part of a comprehensive trading strategy.
The spinning top candlestick pattern is a versatile tool that finds relevance across various financial markets, offering traders valuable insights regardless of the asset class. Its ability to highlight market indecision makes it an essential part of technical analysis in forex, indices, commodities, and stocks.
Forex Markets
In the forex market, spinning tops often signal potential reversals or pauses in currency pair trends. Given the high liquidity and volatility of forex trading, spinning tops can help traders identify moments when buyer and seller momentum is evenly matched, often preceding significant price movements.
Example: In a strong downtrend of the EUR/USD pair, a spinning top appeared near a key support level. The next candlestick was bullish, confirming a reversal. This pattern indicated that bearish momentum had weakened, and buyers were beginning to take control. Following the confirmation, the pair rallied, offering traders a clear buying opportunity.
Stock Markets
In equity markets, spinning tops are commonly used to assess investor sentiment during trend transitions. They often appear at key levels of support or resistance, providing hints about potential price breakouts or reversals. For instance, a spinning top forming after a sustained rally in a stock may suggest that bullish momentum is fading, giving traders time to reassess their positions.
Example: Apple Inc. (AAPL) experienced an extended uptrend, with a spinning top forming at the peak of the rally. The pattern reflected market indecision, as buyers and sellers struggled to maintain momentum. Over the next few days, prices consolidated, moving sideways before eventually reversing downward, validating the spinning top as a sign of trend exhaustion.
Commodities
Spinning tops are highly relevant in commodities trading, where supply and demand dynamics play a pivotal role. In this market, a spinning top might indicate a temporary balance between buyers and sellers, particularly after periods of high volatility. For example, in gold trading, a spinning top at a key resistance level could suggest a potential reversal if confirmed by subsequent bearish candles.
Example: In gold trading, a spinning top formed during an uptrend, near a resistance level. Traders awaited confirmation, and the subsequent candle broke through resistance with a strong bullish close. This example highlights how spinning tops can signal pauses in momentum before trends resume, emphasising the importance of context and confirmation.
Indices
In index trading, spinning tops provide insights into overall market sentiment. They can signal indecision among market participants, especially during periods of economic uncertainty or ahead of significant news events. An index such as the S&P 500 might exhibit spinning tops near historical highs, hinting at a potential reversal or consolidation phase.
While the spinning top’s implications remain consistent across markets, its effectiveness varies depending on the market’s characteristics. High-volatility markets like forex and commodities often yield stronger signals, while more stable markets, such as bonds, may require additional confirmation.
Traders should always combine spinning tops with other tools and strategies tailored to the specific market they are trading. This approach ensures a more comprehensive understanding of price movements and better decision-making across diverse financial instruments.
The spinning top candlestick pattern is a powerful indicator of market indecision, offering insights into potential trend reversals or pauses. By interpreting its structure and position within a trend, traders can gain a deeper understanding of market sentiment and make more informed decisions.
Ready to put your knowledge into practice? With PU Prime’s advanced trading platforms and demo account, you can explore candlestick patterns and develop your trading strategies across forex, stocks, commodities, and more. Start your journey today and trade with confidence!
A spinning top is a candlestick pattern characterised by a small real body and long upper and lower shadows. It represents market indecision, where neither buyers nor sellers have gained control, often signalling a potential pause or reversal in a trend.
The spinning top indicates uncertainty and balance between bullish and bearish forces. In an uptrend, it may suggest weakening momentum and a possible reversal to the downside. In a downtrend, it could signal that selling pressure is fading, potentially leading to an upward reversal.
To trade effectively with spinning tops:
Yes, spinning tops are universal patterns that can appear in any financial market, including forex, stocks, commodities, and indices. Their interpretation remains consistent, though context and confirmation are always essential.
Both patterns indicate indecision, but a doji has almost no real body, with the opening and closing prices virtually identical. In contrast, a spinning top has a small real body and longer shadows, reflecting slightly more directional movement during the session.
Step into the world of trading with confidence today. Open a free PU Prime live CFD trading account now to experience real-time market action, or refine your strategies risk-free with our demo account.
This content is for educational and informational purposes only and should not be considered investment advice, a personal recommendation, or an offer to buy or sell any financial instruments.
This material has been prepared without considering any individual investment objectives, financial situations. Any references to past performance of a financial instrument, index, or investment product are not indicative of future results.
PU Prime makes no representation as to the accuracy or completeness of this content and accepts no liability for any loss or damage arising from reliance on the information provided. Trading involves risk, and you should carefully consider your investment objectives and risk tolerance before making any trading decisions. Never invest more than you can afford to lose.

Trade forex, indices, metal, and more at industry-low spreads and lightning-fast execution.
Sign up for a PU Prime Live Account with our hassle-free process.
Effortlessly fund your account with a wide range of channels and accepted currencies.
Access hundreds of instruments under market-leading trading conditions.
Trading Platforms
Learn
About PU Prime
Corporate

Please note the Website is intended for individuals residing in jurisdictions where accessing the Website is permitted by law.
Please note that PU Prime and its affiliated entities are neither established nor operating in your home jurisdiction.
By clicking the "Acknowledge" button, you confirm that you are entering this website solely based on your initiative and not as a result of any specific marketing outreach. You wish to obtain information from this website which is provided on reverse solicitation in accordance with the laws of your home jurisdiction.
Thank You for Your Acknowledgement!
Ten en cuenta que el sitio web está destinado a personas que residen en jurisdicciones donde el acceso al sitio web está permitido por la ley.
Ten en cuenta que PU Prime y sus entidades afiliadas no están establecidas ni operan en tu jurisdicción de origen.
Al hacer clic en el botón "Aceptar", confirmas que estás ingresando a este sitio web por tu propia iniciativa y no como resultado de ningún esfuerzo de marketing específico. Deseas obtener información de este sitio web que se proporciona mediante solicitud inversa de acuerdo con las leyes de tu jurisdicción de origen.
Thank You for Your Acknowledgement!
20 February 2025,08:11
AdvancedTechnical Analysis
20 February 2025, 08:11
The spinning top candlestick pattern is a powerful indicator in technical analysis, offering traders a window into the ongoing battle between buyers and sellers in the market. Its unique structure and implications provide valuable insights into market sentiment, particularly during periods of indecision. Recognising this pattern can help traders anticipate potential reversals or continuations, equipping them with a deeper understanding of price dynamics.
Understanding the spinning top pattern enhances decision-making by helping traders identify shifts in momentum and gauge the balance of power between bulls and bears. This knowledge is relevant for short-term strategies and long-term trend analysis, making it a versatile tool across forex, stocks, commodities, and indices. By mastering this candlestick formation, traders can improve their ability to navigate market volatility and align their strategies with prevailing trends.
A spinning top is a candlestick pattern that reflects indecision in the market, where neither buyers nor sellers hold a decisive advantage. It is characterised by a small real body located between two long shadows, which indicate significant price movement in both directions during a given trading period.
This pattern typically forms when the opening and closing prices are close to one another, highlighting that while the price was pushed higher and lower during the session, neither side succeeded in establishing control. The spinning top often signals a pause or potential reversal in the current trend, making it a valuable tool for analysing shifts in market sentiment.
The spinning top’s role is essential in identifying moments of equilibrium in a market driven by competing forces. When found at the end of a strong uptrend or downtrend, it suggests that momentum may be weakening, potentially leading to a reversal or a period of consolidation.
The defining feature of a spinning top is its small real body, which reflects minimal difference between the opening and closing prices. This indicates a lack of clear dominance between buyers and sellers during the trading session.
The spinning top features long upper and lower shadows extending from the real body. These shadows reveal significant price movement in both upward and downward directions, highlighting the struggle between bulls and bears. Ideally, the shadows are of similar length.
The context of the spinning top within the market trend is crucial:
The candles preceding and following the spinning top provide important context. A strong reversal candle after the spinning top suggests a potential shift in direction, while a continuation candle signals that the existing trend may persist.
To confirm the significance of a spinning top, traders often use technical tools such as moving averages, RSI, or Bollinger Bands. These indicators help validate the pattern’s implications and provide additional insights into market conditions.
By combining these observations, traders can accurately identify spinning tops and better understand their role in reflecting market sentiment and potential trend changes.
A spinning top is easily recognisable by its small real body and long, balanced shadows, which reflect significant price movement and indecision. Its position within the trend (whether an uptrend, downtrend, or sideways market) provides crucial context for understanding its implications. To confirm its significance, traders should analyse the surrounding candlesticks and use technical indicators for additional validation. Spinning tops serve as a signal of potential pauses or reversals in market momentum.
Spinning tops can appear in two forms: bullish or bearish, depending on the relationship between the opening and closing prices. While both variations share the same core characteristics, they carry different implications depending on their position within the trend.
A bullish spinning top occurs when the closing price is slightly higher than the opening price, resulting in a green or white candle. While it indicates market indecision, its slightly bullish nature suggests a potential reversal or continuation of upward momentum if it appears in specific contexts:
A bearish spinning top forms when the closing price is marginally lower than the opening price, creating a red or black candle. Its slightly bearish sentiment often implies the following:
While the colour of the spinning top provides subtle hints about market sentiment, its overall message remains neutral unless validated by the next candlestick. Traders should focus on the pattern’s position within the trend and combine it with other tools, such as support and resistance levels or technical indicators, to make informed decisions.
Bullish spinning tops close slightly higher than their opening price, hinting at potential upward reversals or trend continuations, especially when found at the end of a downtrend. Bearish spinning tops close slightly lower, signalling potential downward reversals or pauses in an uptrend. Despite these subtle differences, both patterns are neutral on their own and require confirmation from the next candlestick and additional technical analysis to validate their implications.
The spinning top candlestick pattern is a visual representation of market indecision, providing critical insights into trader sentiment and the balance of power between buyers and sellers. Its significance lies in its ability to signal potential turning points in the market or moments of equilibrium during ongoing trends.
Reflecting Market Indecision
A spinning top forms when buyers push prices higher during a session, and sellers counteract by driving prices lower, ultimately resulting in a close near the opening price. This back-and-forth struggle illustrates a lack of clear direction, making the spinning top a key indicator of uncertainty in market sentiment.
Identifying Trend Exhaustion
When a spinning top appears at the end of a strong uptrend or downtrend, it often signals that the prevailing momentum is weakening. In an uptrend, it may suggest that bullish control is fading, paving the way for a potential reversal. Conversely, in a downtrend, it can indicate that selling pressure is losing steam, creating an opportunity for buyers to take over.
Providing Context in Consolidation
In a sideways or range-bound market, spinning tops serve to confirm ongoing indecision, indicating that the market lacks a dominant force to drive prices decisively in either direction. This can help traders anticipate continued consolidation within the range.
Signalling Potential Reversals
The significance of a spinning top is magnified when confirmed by subsequent candlesticks.
For example:
The spinning top’s role as a versatile indicator makes it an essential tool for traders seeking to understand market sentiment and anticipate changes in momentum. By interpreting its context and confirming its implications with additional analysis, traders can align their strategies with evolving market dynamics.
The spinning top candlestick pattern is a valuable tool for traders seeking to identify potential market reversals or periods of consolidation. However, its effectiveness lies in how it is incorporated into a broader trading strategy, often supported by technical analysis and risk management techniques.
Incorporating Spinning Tops into Trading Strategies
Spinning tops are most effective when combined with other tools and contextual analysis. Such as:
Confirming the Pattern
Confirmation is essential when using spinning tops to guide trading decisions. This involves analysing the subsequent candlesticks:
Complementary Indicators
Technical indicators enhance the reliability of spinning tops as trading signals. Commonly used indicators include:
Risk Management
Given the neutral nature of spinning tops, effective risk management is crucial. Strategies include:
For traders looking to refine their skills, a demo account offers a risk-free environment to practice identifying spinning tops and integrating them into a trading strategy. This helps build confidence and precision in real-world applications.
By using spinning tops in conjunction with other analytical tools and disciplined risk management, traders can enhance their ability to make informed decisions and navigate market movements effectively.
While the spinning top candlestick pattern is a valuable tool, traders often make mistakes that can lead to ineffective or risky decisions. Understanding these common errors can help you approach this pattern more strategically and avoid unnecessary losses.
1. Acting Without Confirmation
One of the most frequent mistakes is entering a trade based solely on the spinning top without waiting for confirmation from the next candlestick. The spinning top reflects indecision, and without follow-up price action to clarify the market’s direction, it may lead to false signals.
2. Ignoring Market Context
The effectiveness of a spinning top heavily depends on its position within the trend. Traders often misinterpret spinning tops that appear during a sideways market or consolidation phase, mistaking them for reversal signals. Always evaluate the broader market trend and surrounding candlesticks before making a decision.
3. Overlooking Technical Indicators
Relying solely on the spinning top without incorporating technical indicators such as RSI or moving averages can result in poor analysis. These tools help validate the pattern and provide a clearer picture of market sentiment, improving the accuracy of your trades.
4. Poor Risk Management
The long shadows of a spinning top can make placing stop-loss orders challenging. Traders who neglect proper risk management may set stops too close, leading to premature exits, or too far, resulting in disproportionate risk-to-reward ratios. Always assess the shadow lengths and adjust your position size accordingly.
5. Overtrading Based on Spinning Tops
Because spinning tops are a common pattern, overtrading can occur if traders treat every spinning top as a significant signal. It’s essential to prioritise quality over quantity by focusing on spinning tops that form near key support or resistance levels or within strong trends.
While the spinning top candlestick pattern provides valuable insights into market sentiment, it is not without its limitations. Understanding these constraints is essential for traders to avoid over-reliance on the pattern and to use it effectively within a broader trading strategy.
Frequent Occurrence
Spinning tops are a common candlestick pattern, often appearing during periods of consolidation or low volatility. This prevalence can make it challenging to distinguish meaningful signals from inconsequential patterns. Without additional confirmation, spinning tops alone may not provide reliable trading insights.
Neutral Nature
The neutral character of the spinning top means it reflects indecision rather than a definitive market direction. Traders must rely on subsequent candlesticks or complementary analysis tools to interpret its implications, as it does not inherently indicate whether the trend will reverse or continue.
High Risk of False Signals
When used in isolation, spinning tops can produce false signals, particularly in volatile markets. For example, a spinning top might appear to signal a reversal, but the market may instead resume its previous trend. This unpredictability highlights the importance of context and confirmation.
Risk Management Challenges
The large range between the shadows of a spinning top can make stop-loss placement tricky, potentially increasing the risk-to-reward ratio. This is particularly relevant when the shadows are disproportionately long relative to the body, creating larger areas of price fluctuation.
Lack of Price Targets
Spinning tops do not provide specific price targets or exit points, requiring traders to integrate them with other candlestick patterns or technical indicators to establish a complete trading plan. This limitation underscores the need for a holistic approach to trading.
By recognising the limitations of spinning tops and combining them with other analytical tools, traders can mitigate risks and improve the accuracy of their market predictions. This balanced approach ensures that spinning tops are used effectively as part of a comprehensive trading strategy.
The spinning top candlestick pattern is a versatile tool that finds relevance across various financial markets, offering traders valuable insights regardless of the asset class. Its ability to highlight market indecision makes it an essential part of technical analysis in forex, indices, commodities, and stocks.
Forex Markets
In the forex market, spinning tops often signal potential reversals or pauses in currency pair trends. Given the high liquidity and volatility of forex trading, spinning tops can help traders identify moments when buyer and seller momentum is evenly matched, often preceding significant price movements.
Example: In a strong downtrend of the EUR/USD pair, a spinning top appeared near a key support level. The next candlestick was bullish, confirming a reversal. This pattern indicated that bearish momentum had weakened, and buyers were beginning to take control. Following the confirmation, the pair rallied, offering traders a clear buying opportunity.
Stock Markets
In equity markets, spinning tops are commonly used to assess investor sentiment during trend transitions. They often appear at key levels of support or resistance, providing hints about potential price breakouts or reversals. For instance, a spinning top forming after a sustained rally in a stock may suggest that bullish momentum is fading, giving traders time to reassess their positions.
Example: Apple Inc. (AAPL) experienced an extended uptrend, with a spinning top forming at the peak of the rally. The pattern reflected market indecision, as buyers and sellers struggled to maintain momentum. Over the next few days, prices consolidated, moving sideways before eventually reversing downward, validating the spinning top as a sign of trend exhaustion.
Commodities
Spinning tops are highly relevant in commodities trading, where supply and demand dynamics play a pivotal role. In this market, a spinning top might indicate a temporary balance between buyers and sellers, particularly after periods of high volatility. For example, in gold trading, a spinning top at a key resistance level could suggest a potential reversal if confirmed by subsequent bearish candles.
Example: In gold trading, a spinning top formed during an uptrend, near a resistance level. Traders awaited confirmation, and the subsequent candle broke through resistance with a strong bullish close. This example highlights how spinning tops can signal pauses in momentum before trends resume, emphasising the importance of context and confirmation.
Indices
In index trading, spinning tops provide insights into overall market sentiment. They can signal indecision among market participants, especially during periods of economic uncertainty or ahead of significant news events. An index such as the S&P 500 might exhibit spinning tops near historical highs, hinting at a potential reversal or consolidation phase.
While the spinning top’s implications remain consistent across markets, its effectiveness varies depending on the market’s characteristics. High-volatility markets like forex and commodities often yield stronger signals, while more stable markets, such as bonds, may require additional confirmation.
Traders should always combine spinning tops with other tools and strategies tailored to the specific market they are trading. This approach ensures a more comprehensive understanding of price movements and better decision-making across diverse financial instruments.
The spinning top candlestick pattern is a powerful indicator of market indecision, offering insights into potential trend reversals or pauses. By interpreting its structure and position within a trend, traders can gain a deeper understanding of market sentiment and make more informed decisions.
Ready to put your knowledge into practice? With PU Prime’s advanced trading platforms and demo account, you can explore candlestick patterns and develop your trading strategies across forex, stocks, commodities, and more. Start your journey today and trade with confidence!
A spinning top is a candlestick pattern characterised by a small real body and long upper and lower shadows. It represents market indecision, where neither buyers nor sellers have gained control, often signalling a potential pause or reversal in a trend.
The spinning top indicates uncertainty and balance between bullish and bearish forces. In an uptrend, it may suggest weakening momentum and a possible reversal to the downside. In a downtrend, it could signal that selling pressure is fading, potentially leading to an upward reversal.
To trade effectively with spinning tops:
Yes, spinning tops are universal patterns that can appear in any financial market, including forex, stocks, commodities, and indices. Their interpretation remains consistent, though context and confirmation are always essential.
Both patterns indicate indecision, but a doji has almost no real body, with the opening and closing prices virtually identical. In contrast, a spinning top has a small real body and longer shadows, reflecting slightly more directional movement during the session.
Trade forex, indices, metal, and more at industry-low spreads and lightning-fast execution.
Sign up for a PU Prime Live Account with our hassle-free process.
Effortlessly fund your account with a wide range of channels and accepted currencies.
Access hundreds of instruments under market-leading trading conditions.
Sign up for a PU Prime Live Account with our hassle-free process.
Effortlessly fund your account with a wide range of channels and accepted currencies.
Access hundreds of instruments under market-leading trading conditions.