


-
- Trading Platforms
- PU Prime App
- MetaTrader 5
- MetaTrader 4
- PU Copy Trading
- Web Trader
- PU Social
-
- Trading Conditions
- Account Types
- Spreads, Costs & Swaps
- Deposits & Withdrawals
- Fee & Charges
- Trading Hours


EN
25 June 2024,05:28
Daily Market Analysis
25 June 2024, 05:28


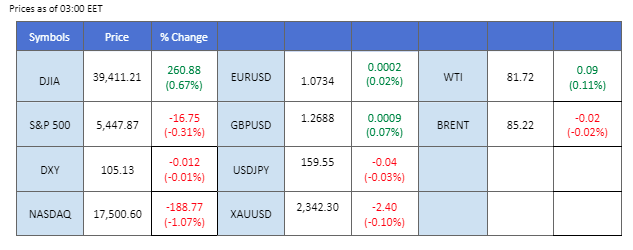
The dollar has eased from its bullish trend, which was fueled by upbeat PMI readings last Friday. Apart from Friday’s PCE reading, traders are also keeping an eye on Wednesday’s U.S. 5-year note auction to gauge market sentiment toward the Fed’s upcoming monetary policy and its implications for the dollar’s strength.
On Wall Street, there were mixed results; the Dow Jones continued to trade upward, while tech-heavy indexes were weighed down by plummeting tech stocks, with Nvidia leading the slump, losing $430 billion in market value.
In Japan, as the Japanese Yen continues to slide, strategists suggest that the Yen could slump to the 170 mark against the dollar, citing that short-term market intervention would not help the lacklustre Yen.
In the commodity market, gold and oil prices edged higher in the last session mainly due to the easing of the dollar. However, both commodities are currently lacking catalysts.
Additionally, Bitcoin (BTC) slid below the $60,000 mark in the last session as bearish sentiment overwhelmed the crypto market. The repayment by the defunct crypto exchange Mt. Gox, worth $9 billion in BTC, is believed to be a trigger point for the selling sentiment. Over the week, crypto ETF outflows reached as high as $1.2 billion, worsening the situation.
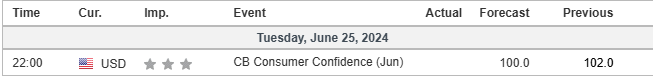
Current rate hike bets on 31st July Fed interest rate decision:
Source: CME Fedwatch Tool0 bps (91.7%) VS -25 bps (8.3%)
(MT4 System Time)
Source: MQL5
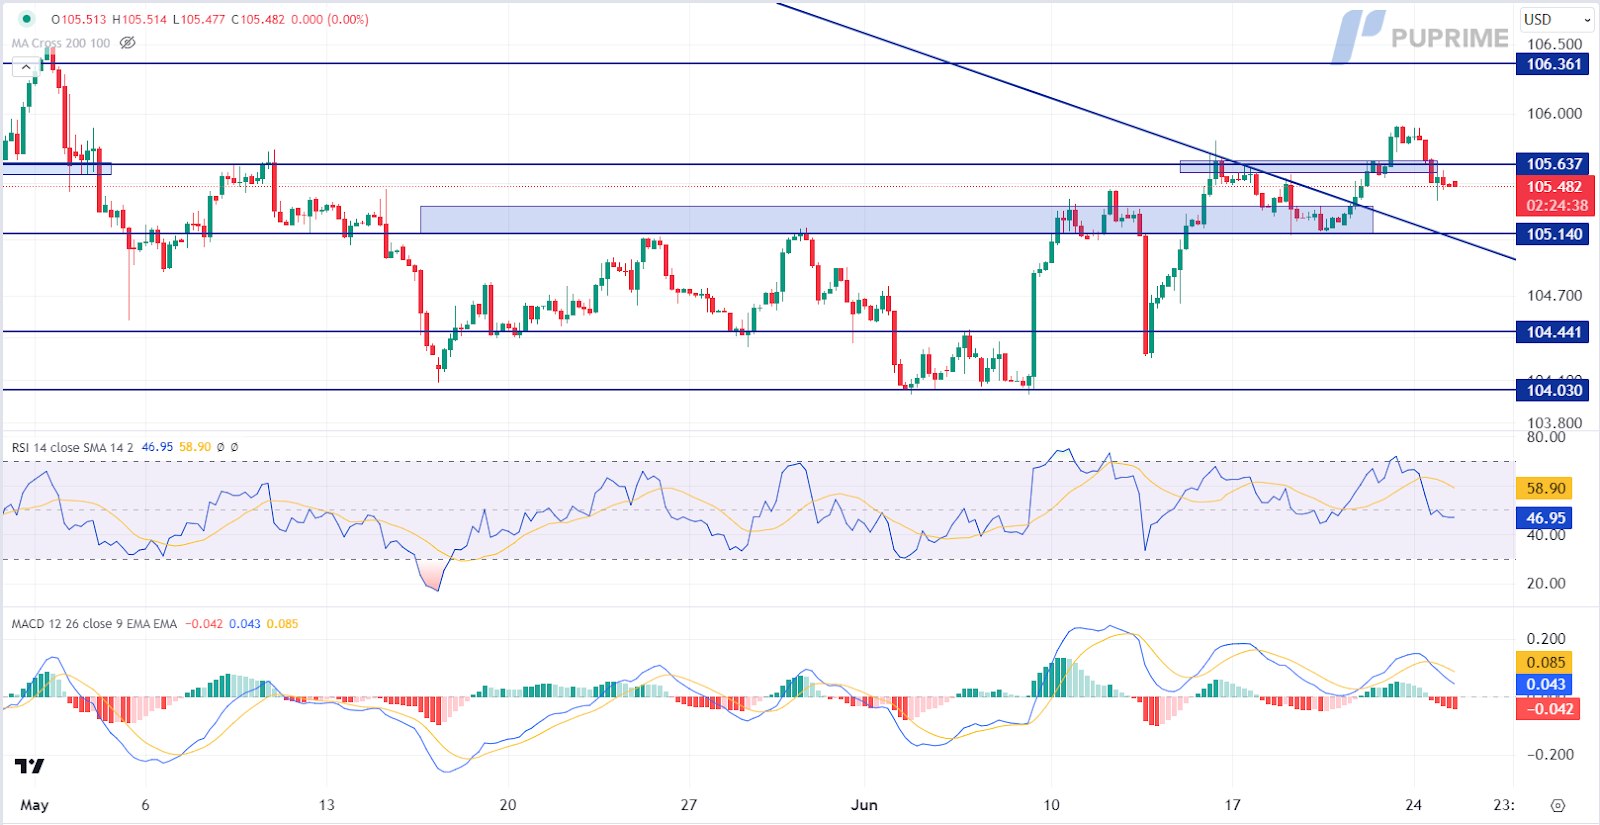
The Dollar Index, trading against a basket of six major currencies, continued to extend its losses ahead of several crucial US economic data releases and events this week. Rising uncertainties in the US have diminished demand for the dollar. Meanwhile, the Japanese yen continues to drop to record lows, raising expectations of yen intervention. Investors fear that yen intervention may also diminish the price of the US dollar as they sell dollars to purchase yen. The spotlight this week will be on Friday’s release of the US Personal Consumption Expenditures (PCE) Price Index, with other crucial data, including US GDP and Initial Jobless Claims, remaining on investors’ radar.
The Dollar Index is trading lower following the prior retracement from the resistance level. MACD has illustrated increasing bearish momentum, while RSI is at 47, suggesting the index might extend its losses since the RSI stays below the midline.
Resistance level: 105.65, 106.35
Support level: 105.15, 104.45
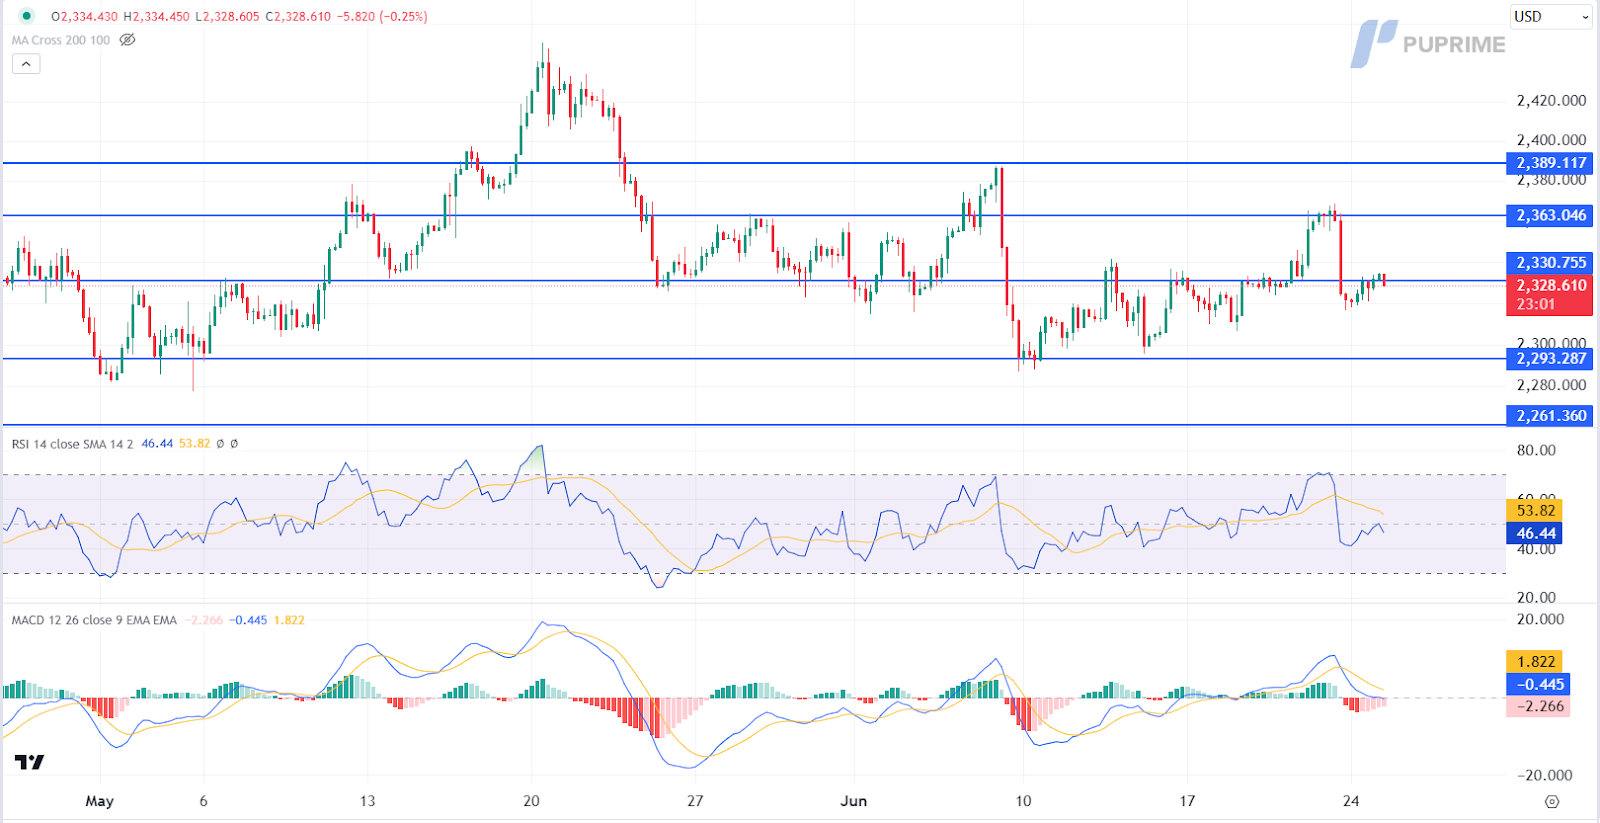
Gold prices rebounded slightly yesterday, buoyed by the depreciation of the US dollar. The diminishing risk appetite, reflected in the dip in US equity indexes and cryptocurrencies, prompted investors to shift their portfolios into safer options, including gold. Additionally, anticipation of crucial US economic events, such as the PCE Price Index and GDP data, has supported gold prices. Moving ahead this week, investors should focus on these data releases and events to gain further trading signals.
Gold prices are trading higher while currently testing the resistance level. MACD has illustrated diminishing bearish momentum, while RSI is at 47, suggesting the commodity might extend its gains after breakout since the RSI rebounded sharply from oversold territory.
Resistance level: 2330.00, 2365.00
Support level: 2295.00, 2260.00
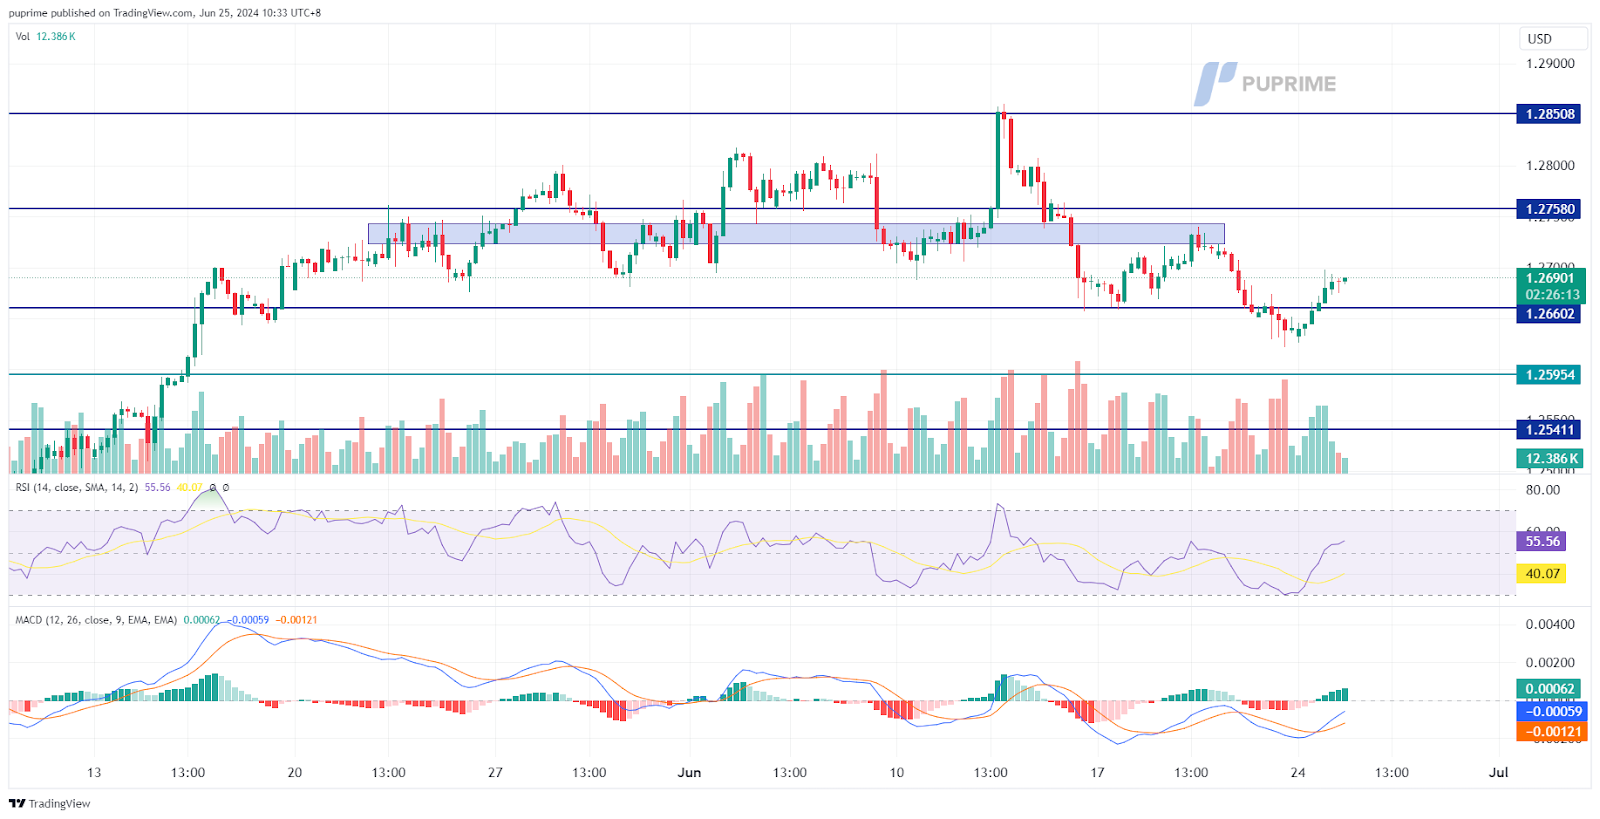
The Pound Sterling has rebounded from its lowest level in a month against the dollar. However, it has yet to reach its previous high and should not be considered a trend-reversal signal for the pair. Pound Sterling traders may focus on Friday’s UK GDP figure and be cautious of political uncertainty as the UK is having its general election next week.
GBP/USD has rebounded but is facing a resistance level at near 1.2720. The RSI has rebounded from the oversold zone, while the MACD remains hovering below the zero line, suggesting the bearish momentum remains intact.
Resistance level: 1.2760. 1.2850
Support level: 1.2660, 1.2600
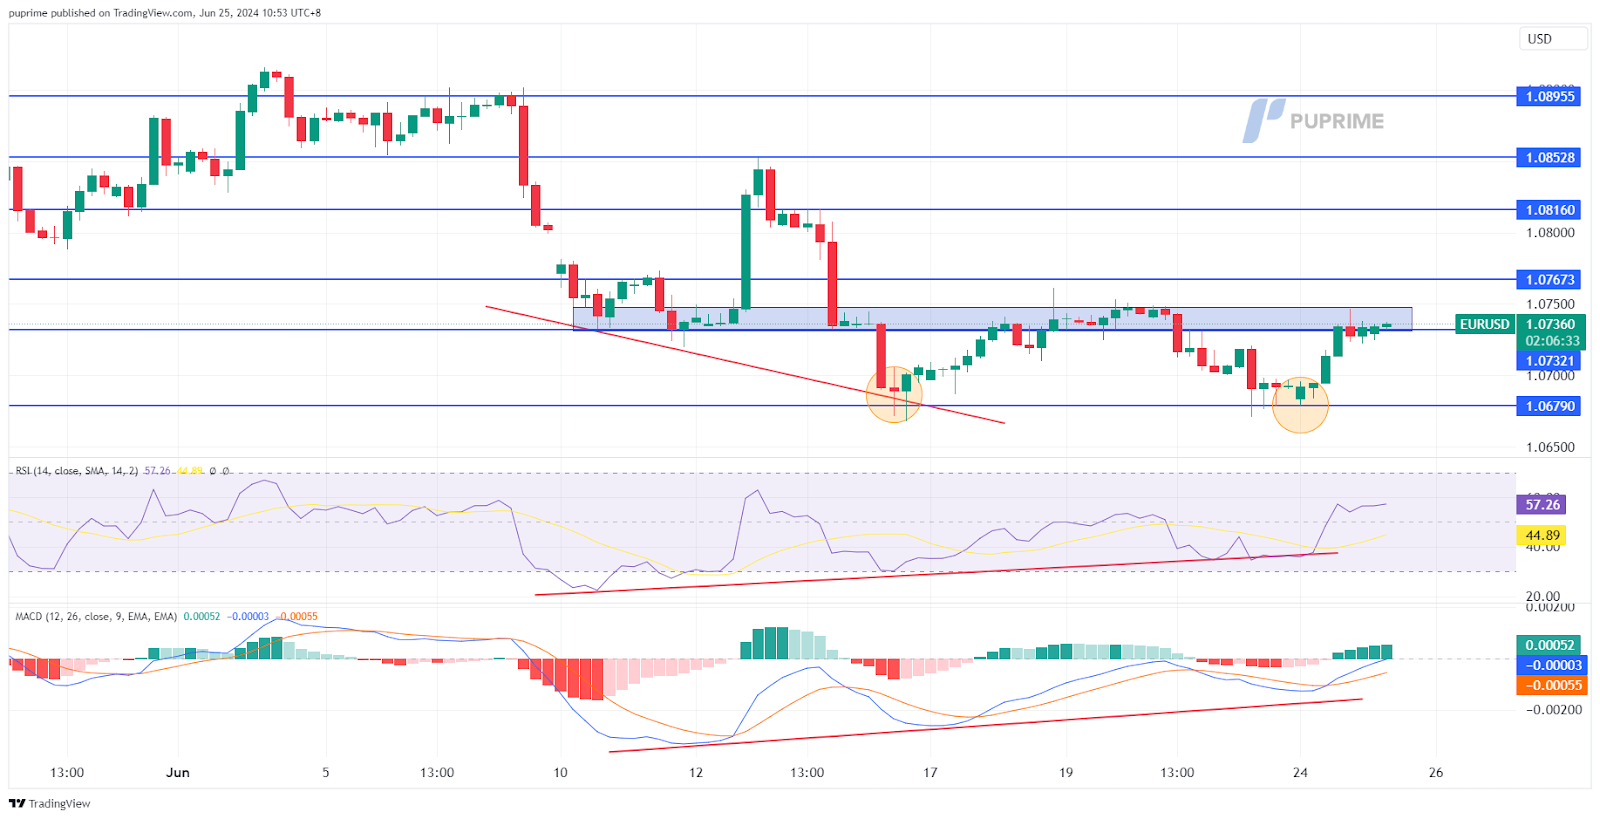
The EUR/USD pair has formed a double-bottom pattern at its crucial support level of 1.0680 and is currently trading back to its liquidity zone near 1.0740. Yesterday’s uptrend was primarily driven by the weakness of the dollar, which experienced a technical correction. Since the euro is lacking catalysts, the pair’s movement will likely be influenced by upcoming U.S. economic indicators, including GDP, Initial Jobless Claims, and PCE, due later this week.
The EUR/USD is currently suppressed at its liquidity zone at near 1.0740. A break above this level suggests a solid bullish signal for the pair. The RSI has been gradually moving upward, while the MACD is breaking above the zero line, suggesting bullish momentum is forming.
Resistance level: 1.0760, 1.0810
Support level: 1.0680, 1.0612
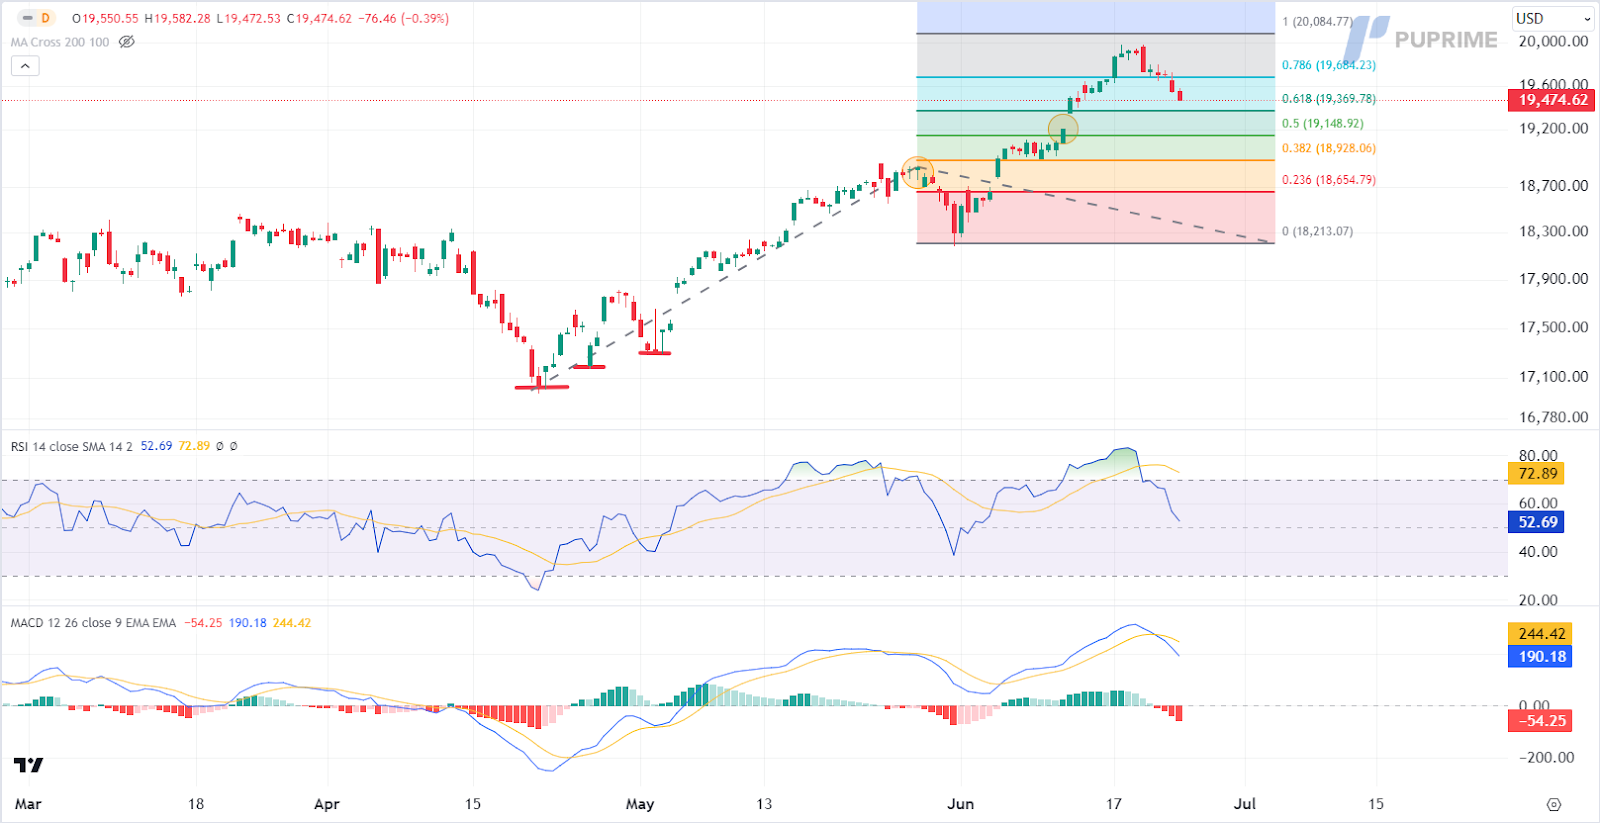
The Nasdaq dropped from record highs, mostly due to profit-taking ahead of crucial US economic data. Nvidia shares fell another 6.70% yesterday, extending losses for a third straight session, which also dragged down the tech-heavy index. On the macroeconomic front, focus will now remain on several key economic data releases and the US political scene. On the latter point, US President Joe Biden and presumptive Republican nominee Donald Trump are set for their first debate Thursday evening. With several significant events happening this week, risk appetite in the market remains weak, likely weighing on the appeal of the US equity market.
Nasdaq is trading lower following the prior breakout below the previous support level. MACD has illustrated increasing bearish momentum, while RSI is at 53, suggesting the index might extend its losses toward support level since the RSI retreated sharply from overbought territory.
Resistance level: 19685.00, 20085.00
Support level: 19370.00, 19150.00
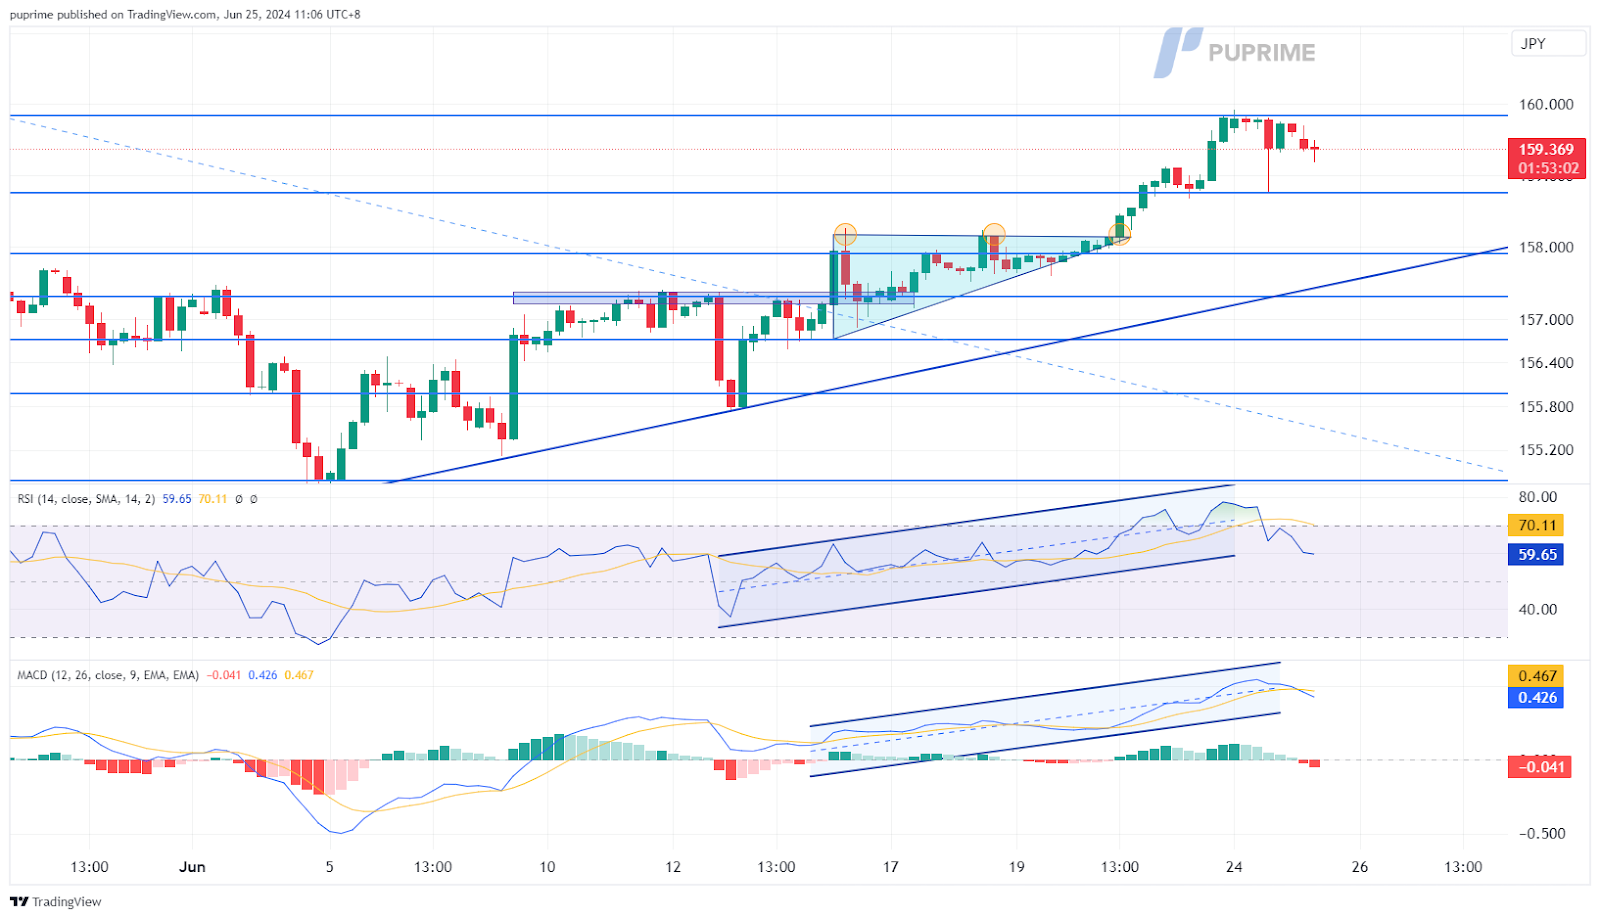
The Japanese Yen continues to face strong selling pressure as the market perceives that the Fed may maintain high interest rates for an extended period. The significant interest rate discrepancy between the two nations makes U.S. assets more appealing, further exerting selling pressure on the Yen. Strategists forecast that the USD/JPY could reach the 170 mark, as they believe that short-term market interventions by Japanese authorities will have limited effect.
USD/JPY is currently facing strong resistance at 159.85 and waiting for a catalyst to break above it. The RSI is easing from the overbought zone, while the MACD is flowing at the elevated level, suggesting the pair remains trading with bullish momentum.
Resistance level: 161.20, 162.00
Support level: 158.75, 157.90
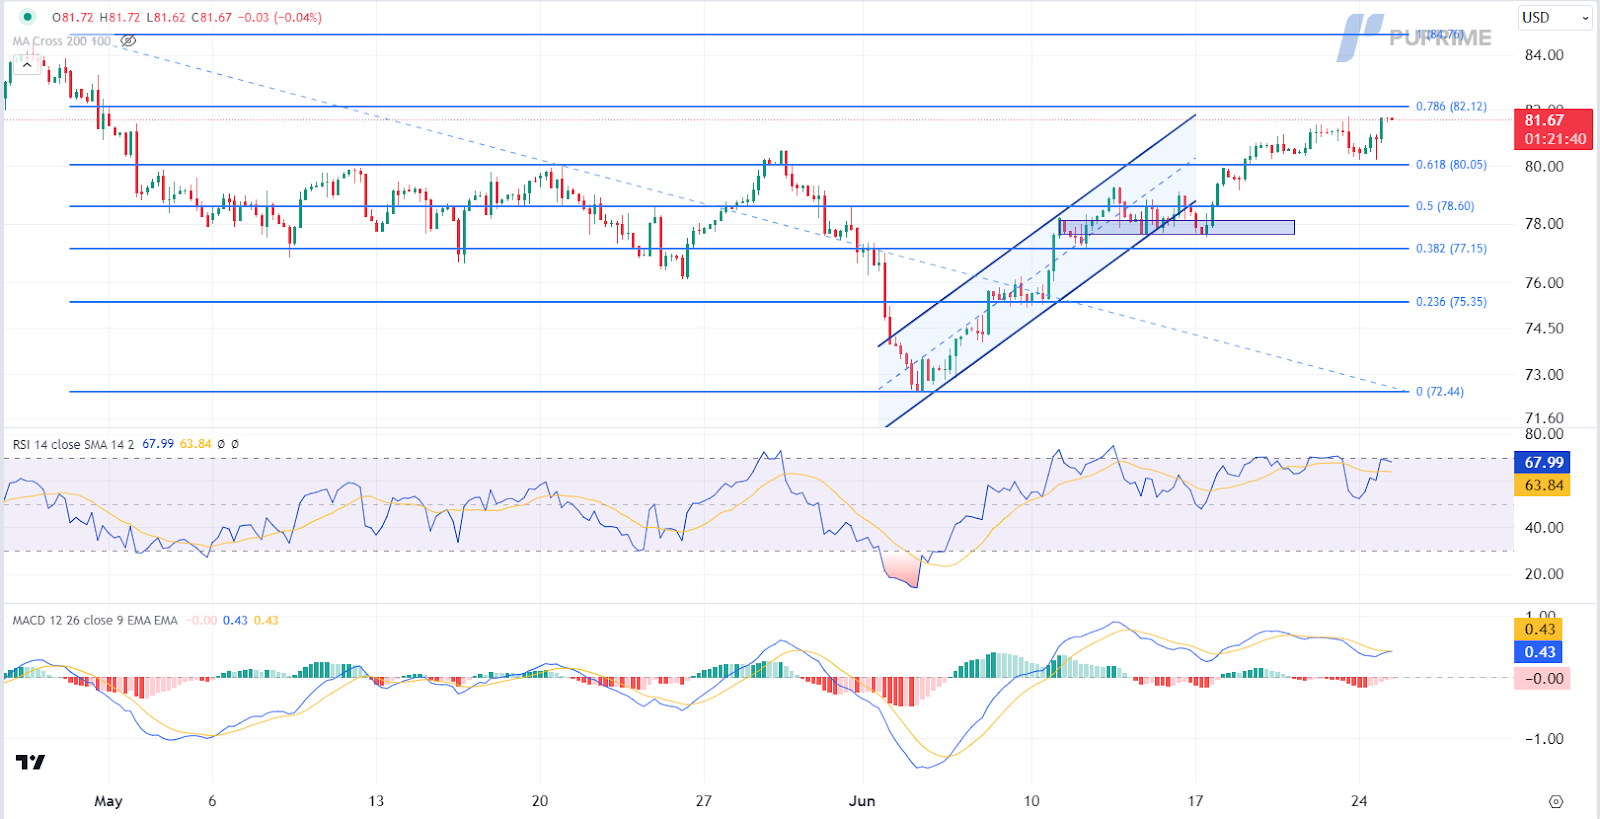
Crude oil prices continued to extend their gains, buoyed by the depreciation of the US dollar and rising expectations of increased future oil demand. With several major central banks, including the European Central Bank and the Swiss National Bank, anticipating easing monetary policies, the appeal for oil demand remains positive. Moving ahead this week, investors will eye US crude oil inventories to receive further trading signals.
Oil prices are trading higher following the prior rebound from the support level. MACD has illustrated diminishing bearish momentum. However, RSI is at 68, suggesting the commodity might enter overbought territory.
Resistance level: 82.10, 84.75
Support level: 80.05, 78.60
Step into the world of trading with confidence today. Open a free PU Prime live CFD trading account now to experience real-time market action, or refine your strategies risk-free with our demo account.
This content is for educational and informational purposes only and should not be considered investment advice, a personal recommendation, or an offer to buy or sell any financial instruments.
This material has been prepared without considering any individual investment objectives, financial situations. Any references to past performance of a financial instrument, index, or investment product are not indicative of future results.
PU Prime makes no representation as to the accuracy or completeness of this content and accepts no liability for any loss or damage arising from reliance on the information provided. Trading involves risk, and you should carefully consider your investment objectives and risk tolerance before making any trading decisions. Never invest more than you can afford to lose.

Trade forex, indices, metal, and more at industry-low spreads and lightning-fast execution.
Sign up for a PU Prime Live Account with our hassle-free process.
Effortlessly fund your account with a wide range of channels and accepted currencies.
Access hundreds of instruments under market-leading trading conditions.
Trading Platforms
Learn
About PU Prime
Corporate

Please note the Website is intended for individuals residing in jurisdictions where accessing the Website is permitted by law.
Please note that PU Prime and its affiliated entities are neither established nor operating in your home jurisdiction.
By clicking the "Acknowledge" button, you confirm that you are entering this website solely based on your initiative and not as a result of any specific marketing outreach. You wish to obtain information from this website which is provided on reverse solicitation in accordance with the laws of your home jurisdiction.
Thank You for Your Acknowledgement!
Ten en cuenta que el sitio web está destinado a personas que residen en jurisdicciones donde el acceso al sitio web está permitido por la ley.
Ten en cuenta que PU Prime y sus entidades afiliadas no están establecidas ni operan en tu jurisdicción de origen.
Al hacer clic en el botón "Aceptar", confirmas que estás ingresando a este sitio web por tu propia iniciativa y no como resultado de ningún esfuerzo de marketing específico. Deseas obtener información de este sitio web que se proporciona mediante solicitud inversa de acuerdo con las leyes de tu jurisdicción de origen.
Thank You for Your Acknowledgement!
25 June 2024,05:28
Daily Market Analysis
25 June 2024, 05:28
The dollar has eased from its bullish trend, which was fueled by upbeat PMI readings last Friday. Apart from Friday’s PCE reading, traders are also keeping an eye on Wednesday’s U.S. 5-year note auction to gauge market sentiment toward the Fed’s upcoming monetary policy and its implications for the dollar’s strength.
On Wall Street, there were mixed results; the Dow Jones continued to trade upward, while tech-heavy indexes were weighed down by plummeting tech stocks, with Nvidia leading the slump, losing $430 billion in market value.
In Japan, as the Japanese Yen continues to slide, strategists suggest that the Yen could slump to the 170 mark against the dollar, citing that short-term market intervention would not help the lacklustre Yen.
In the commodity market, gold and oil prices edged higher in the last session mainly due to the easing of the dollar. However, both commodities are currently lacking catalysts.
Additionally, Bitcoin (BTC) slid below the $60,000 mark in the last session as bearish sentiment overwhelmed the crypto market. The repayment by the defunct crypto exchange Mt. Gox, worth $9 billion in BTC, is believed to be a trigger point for the selling sentiment. Over the week, crypto ETF outflows reached as high as $1.2 billion, worsening the situation.
Current rate hike bets on 31st July Fed interest rate decision:
Source: CME Fedwatch Tool0 bps (91.7%) VS -25 bps (8.3%)
(MT4 System Time)
Source: MQL5
The Dollar Index, trading against a basket of six major currencies, continued to extend its losses ahead of several crucial US economic data releases and events this week. Rising uncertainties in the US have diminished demand for the dollar. Meanwhile, the Japanese yen continues to drop to record lows, raising expectations of yen intervention. Investors fear that yen intervention may also diminish the price of the US dollar as they sell dollars to purchase yen. The spotlight this week will be on Friday’s release of the US Personal Consumption Expenditures (PCE) Price Index, with other crucial data, including US GDP and Initial Jobless Claims, remaining on investors’ radar.
The Dollar Index is trading lower following the prior retracement from the resistance level. MACD has illustrated increasing bearish momentum, while RSI is at 47, suggesting the index might extend its losses since the RSI stays below the midline.
Resistance level: 105.65, 106.35
Support level: 105.15, 104.45
Gold prices rebounded slightly yesterday, buoyed by the depreciation of the US dollar. The diminishing risk appetite, reflected in the dip in US equity indexes and cryptocurrencies, prompted investors to shift their portfolios into safer options, including gold. Additionally, anticipation of crucial US economic events, such as the PCE Price Index and GDP data, has supported gold prices. Moving ahead this week, investors should focus on these data releases and events to gain further trading signals.
Gold prices are trading higher while currently testing the resistance level. MACD has illustrated diminishing bearish momentum, while RSI is at 47, suggesting the commodity might extend its gains after breakout since the RSI rebounded sharply from oversold territory.
Resistance level: 2330.00, 2365.00
Support level: 2295.00, 2260.00
The Pound Sterling has rebounded from its lowest level in a month against the dollar. However, it has yet to reach its previous high and should not be considered a trend-reversal signal for the pair. Pound Sterling traders may focus on Friday’s UK GDP figure and be cautious of political uncertainty as the UK is having its general election next week.
GBP/USD has rebounded but is facing a resistance level at near 1.2720. The RSI has rebounded from the oversold zone, while the MACD remains hovering below the zero line, suggesting the bearish momentum remains intact.
Resistance level: 1.2760. 1.2850
Support level: 1.2660, 1.2600
The EUR/USD pair has formed a double-bottom pattern at its crucial support level of 1.0680 and is currently trading back to its liquidity zone near 1.0740. Yesterday’s uptrend was primarily driven by the weakness of the dollar, which experienced a technical correction. Since the euro is lacking catalysts, the pair’s movement will likely be influenced by upcoming U.S. economic indicators, including GDP, Initial Jobless Claims, and PCE, due later this week.
The EUR/USD is currently suppressed at its liquidity zone at near 1.0740. A break above this level suggests a solid bullish signal for the pair. The RSI has been gradually moving upward, while the MACD is breaking above the zero line, suggesting bullish momentum is forming.
Resistance level: 1.0760, 1.0810
Support level: 1.0680, 1.0612
The Nasdaq dropped from record highs, mostly due to profit-taking ahead of crucial US economic data. Nvidia shares fell another 6.70% yesterday, extending losses for a third straight session, which also dragged down the tech-heavy index. On the macroeconomic front, focus will now remain on several key economic data releases and the US political scene. On the latter point, US President Joe Biden and presumptive Republican nominee Donald Trump are set for their first debate Thursday evening. With several significant events happening this week, risk appetite in the market remains weak, likely weighing on the appeal of the US equity market.
Nasdaq is trading lower following the prior breakout below the previous support level. MACD has illustrated increasing bearish momentum, while RSI is at 53, suggesting the index might extend its losses toward support level since the RSI retreated sharply from overbought territory.
Resistance level: 19685.00, 20085.00
Support level: 19370.00, 19150.00
The Japanese Yen continues to face strong selling pressure as the market perceives that the Fed may maintain high interest rates for an extended period. The significant interest rate discrepancy between the two nations makes U.S. assets more appealing, further exerting selling pressure on the Yen. Strategists forecast that the USD/JPY could reach the 170 mark, as they believe that short-term market interventions by Japanese authorities will have limited effect.
USD/JPY is currently facing strong resistance at 159.85 and waiting for a catalyst to break above it. The RSI is easing from the overbought zone, while the MACD is flowing at the elevated level, suggesting the pair remains trading with bullish momentum.
Resistance level: 161.20, 162.00
Support level: 158.75, 157.90
Crude oil prices continued to extend their gains, buoyed by the depreciation of the US dollar and rising expectations of increased future oil demand. With several major central banks, including the European Central Bank and the Swiss National Bank, anticipating easing monetary policies, the appeal for oil demand remains positive. Moving ahead this week, investors will eye US crude oil inventories to receive further trading signals.
Oil prices are trading higher following the prior rebound from the support level. MACD has illustrated diminishing bearish momentum. However, RSI is at 68, suggesting the commodity might enter overbought territory.
Resistance level: 82.10, 84.75
Support level: 80.05, 78.60
Trade forex, indices, metal, and more at industry-low spreads and lightning-fast execution.
Sign up for a PU Prime Live Account with our hassle-free process.
Effortlessly fund your account with a wide range of channels and accepted currencies.
Access hundreds of instruments under market-leading trading conditions.
Sign up for a PU Prime Live Account with our hassle-free process.
Effortlessly fund your account with a wide range of channels and accepted currencies.
Access hundreds of instruments under market-leading trading conditions.