


-
- Trading Platforms
- PU Prime App
- MetaTrader 5
- MetaTrader 4
- PU Copy Trading
- Web Trader
- PU Social
-
- Trading Conditions
- Account Types
- Spreads, Costs & Swaps
- Deposits & Withdrawals
- Fee & Charges
- Trading Hours


EN
20 February 2025,08:31
How-toIntermediateTechnical Analysis
20 February 2025, 08:31

The Doji candlestick pattern is one of the most important patterns to master in financial market analysis. This very peculiar pattern represents the never-ending war between the buyers and sellers of the financial world. Because of their peculiarness, they are a critical indicator of a potential reversal in the market. Unlike many other patterns, the Doji candlestick pattern is a single candlestick, and this pattern indicates a state of indecisiveness in the market. It is a pattern where the opening and the closing price of an asset security or market are equal or very close to each other.
This can mean a few different things in the financial world and can be used to the trader’s advantage. After such patterns, there is a shift in the market. The real question is whether the shift will be potentially bullish or bearish in nature. This is where the speculative trading through CFD comes in. Traders can predict the shift in the market and consequently make a profit. The Doji candlestick is thus an important single candlestick pattern for traders interested in CFD trading.
Candlesticks and patterns are the cornerstone of technical analysis, and understanding and interpreting them effectively is the mark of a good financial analyst, trader, and investor. The candlesticks indicate the fluctuating price of the assets, which are crucial for making viable financial decisions. These patterns signal a potential change in the market and can explain a lot about the sentiment of the buyers, sellers, and the general market. These patterns are often used in conjunction with other important indicators and analyses to confirm the signal.
When used with other technical analysis indicators, the Doji candlestick pattern increases prediction power. There are a few different types of Doji candlestick patterns, each representing a certain market sentiment and price fluctuation scenario. As a beginner trader, learning to spot and interpret such candlestick patterns is of utmost importance. For this reason, in this article, we bring you a complete information package on the Doji candlestick pattern, its types, its interpretation in the market, and much more.
The Doji candle is a single candlestick pattern where the underlying asset’s open and close prices are equal or incredibly close to each other. This means that the price at which the asset (stocks, futures, bonds, etc.) opened somehow can exactly equal or close to the price that the asset closed on. So, there was no significant difference in price point. Doji is a Japanese word that means “same matter”, which perfectly represents this candlestick pattern.
The pattern is represented by a small candle length, meaning that the asset’s trading range was small and can have a long or short wick on either side. The length of the wick represents market volatility and is an important trait to interpret when making decisions. This type of pattern can be found anywhere on the chart, which showcases the unpredictability of the market. The pattern essentially shows a state of market indecision. Imagine a game of tug of war in which no one wins, but ends in a tie.
Right after the tie, the players start tugging again, and one side is more fierce than the other, and that side wins. When a Doji candlestick pattern forms, the pattern is the state where no one wins among the buyers and the sellers. But right after, the buyers can push the price up in a bullish reversal, or the sellers can decrease the price in a bearish reversal.
Now, in this whole scenario, traders who are interested in speculative trading using CFDs can make a potential profit. Right after the Doji candlestick pattern in the chart, a bearish or bullish reversal is due. This is because the candlestick pattern represents market indecision, and soon after, the market will be pulled to a side. The speculative traders can thus predict the winning side for making a profit.
It is important to mention that these patterns are mere predictive signals and do not predict reversals. These signals need to be thoroughly confirmed by using different technical analysis tools and metrics. In addition, the trader’s prior market knowledge is also very important. For beginners, we suggest using a demo account to first experience and practice their hand on different patterns before entering the real fluctuating world of financial trading and investment.
A Doji candlestick pattern can be identified through a single candlestick with a shorter or non-existent body and a longer or shorter wick on either side. However, these pattern components can move around and give us different types of candlestick patterns. Each pattern is unique in interpretation and design. Following are the four different types of candlestick patterns that traders of every level should know:
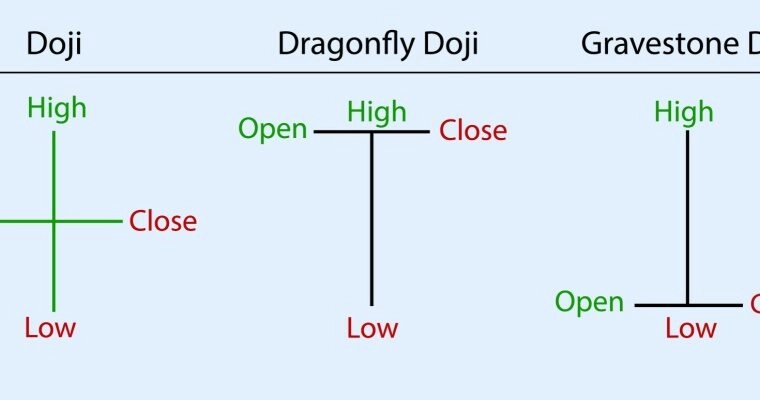
A dragonfly Doji is an interesting type of Doji pattern. Its body looks exactly like that of a dragonfly, hence the name. This type of Doji pattern has a long lower wick with a small, non-existent body and no upper wick. This indicates that the sellers initially brought the price down, and then the buyers tried to push it up, so the price closed near the opening price. This type of pattern is most commonly seen near the end of a downtrend and can indicate a potential bullish reversal.
The gravestone Doji is the opposite of the dragonfly Doji. Such a Doji pattern has a long upper wick with a small, non-existent body and no lower wick. This indicates that the buyers initially brought the price up, and then the sellers tried to push it down, so the price closed near the opening price. This type of pattern is most commonly seen near the end of an uptrend and can indicate a potential bearish reversal.
A hammer candlestick pattern closely relates to the dragonfly Doji pattern in appearance and is, therefore, sometimes mistaken as a Doji candlestick. A hammer candlestick pattern has a short upper body and a long lower body with an existent body in the middle. It typically appears after a downtrend and hints at a potential bullish reversal.
A cross Doji is a symmetrical pattern where the upper and the lower wick are of equal lengths and have small or a non-existent body. This type of pattern indicates a very strong indecision in the market. Although it signals a potential trend reversal, it is hard to anticipate whether it will be bearish or bullish. Further indicators are used to confirm the direction of the trend reversal.
These are the few ways a Doji candlestick pattern can appear in the charts. Understanding each of them and how they differ from other candlestick patterns is important to form a decision. We cannot stress enough that these patterns are only hints that need further confirmation. Acting on their hints without confirming the trends can be a dangerous move to play.
The Doji candlestick pattern indicates a state of indecisiveness in the market. The buyers and the sellers are both in action, and the positive and negative price movements cancel each other out. Soon, one of them will gain the upper hand, and the market will shift in their favour, possibly showing a bullish or a bearish reversal. Thus, these candlestick patterns can be bullish or bearish in nature. Here we look at distinct differences between the two:
A bullish Doji candlestick indicates a chance of a bullish reversal after a downtrend. Physically, this type of candlestick has a long lower wick, indicating strong selling volume with a small, non-existent body and no upper wick. This indicates that the sellers initially brought the price down, and then the buyers tried to push it up. The buyers managed to get some control, so the price closed near the opening price. This type of pattern is most commonly seen near the end of a downtrend and can indicate a potential bullish reversal.
The most common examples of a bullish Doji candlestick are the dragonfly Doji candlestick and a hammer candlestick pattern. Here, the buyers try to support the asset, and the sellers move against it. When traders trade on such a pattern, it is important to not only look at the pattern, the market volume, and the size of the body but also have a good knowledge of the asset and the general market sentiment. This is only gained through experience and interest in world news and the metrics that affect the world’s financial markets.
On the other hand, a bearish Doji candlestick potentially indicates a possible bearish trend reversal in the chart. Such a pattern occurs at the top of an uptrend. This means the buyers controlled the situation and increased the price, but the sellers tried to gain control. In the end, the sellers did take control, and the price closed near where it opened. The gravestone Doji and shooting star patterns are all bearish Doji candlestick patterns.
This pattern indicates an increasing selling volume because the sellers have the last control over the underlying asset. Traders who do speculative trading using CFDs can use this pattern to strategise potential exit and entry points for their trades, speculate the direction and the extent of the movement, and much more.
Confirming any of these candlestick patterns before acting on the signals is very important. Various technical analysis patterns and indicators can be used to confirm these patterns. With prior knowledge about the underlying asset, traders can form viable decisions about the trade and potential entry and exit points.
As explained before, acting on Doji patterns alone is not recommended. Different metrics should be used in conjunction to accurately understand the state of the market and its possible outcome. One such additional indicator is volume. Market volume is the total number of financial assets traded during a set amount of time. Investors and traders use market volume to determine the liquidity in the market. In contrast, financial analysts use market volume to identify trends and patterns and, most importantly, to confirm price movements.
Now, we know quite a few types of the Doji candlestick pattern. Most important are the dragonfly and the gravestone Doji candlestick patterns. The dragonfly Doji pattern has a long lower wick with a small, non-existent body and no upper wick. This indicates that the sellers initially brought the price down, and then the buyers tried to push it up, so the price closed near the opening price. This type of pattern is most commonly seen near the end of a downtrend and can indicate a potential bullish reversal.
The gravestone Doji is the opposite of the dragonfly Doji and has a long upper wick with a small, non-existent body and no lower wick. This indicates that the buyers initially brought the price up, and then the sellers tried to push it down, so the price closed near the opening price. This type of pattern is most commonly seen near the end of an uptrend and can indicate a potential bearish reversal.
To validate these patterns, traders look for a high trading volume. High trading volume indicates that the Doji signal is strong and potential reversal is imminent. Combining this with the type of Doji signal, either dragonfly (bullish) or gravestone (bearish), can help validate the Doji signal. In speculative trading using CFDs, traders make use of this combination regularly.
Doji candlestick patterns occur when, due to market indecisiveness, an asset’s closing and opening price are identical. This market indecision is due to sellers and buyers trying to manipulate the market. Doji candles are single candlesticks with long or short wicks and a small or non-existent body. There are a few types of Doji candlesticks, which include dragonfly, gravestone, and other patterns. A Doji pattern can be bullish if it appears after a downtrend or bearish after an uptrend. Either way, it signals a potential reversal.
In speculative trading using CFDs, traders can make use of this pattern to speculate whether the trend will be bearish or bullish. As a trader trading in CFDs does not own the actual asset but makes a profit on speculating price movements, this pattern sits perfectly in their arsenal of technical analysis tools. It is important here to know that, this tool on its own can be useful, but when combined with other technical analysis tools, the signal can be positively validated.
There are quite a number of common misinterpretations of Doji candlestick patterns. These misconceptions can effect the trading outcomes that the traders were looking for. Here we mention a few of these misconceptions:
This is wrong. Even though the Doji pattern is a single candlestick pattern, it still has different types. Namely, bearish doji candlesticks, bullish doji candlesticks, gravestone doji candlesticks, dragonfly doji candlesticks, etc.
Doji signals do not validate possible trend reversals, but they only hint at the possibility of a trend reversal. Further technical analysis indicators are then used to validate possible trend reversals.
This is untrue. Not all Doji signals mean that a possible trend reversal will occur. A few more market conditions go into validating a possible trend reversal, whether it is bearish or bullish.
These are only a few different misconceptions about the pattern. It is best to avoid them wherever possible and always do your due research and study before making any sort of financial decisions in the trading market.
The Doji candle is a single candlestick pattern where the underlying asset’s open and close prices are equal or incredibly close to each other. This means that the price at which the asset (stocks, futures, bonds, etc.) opened somehow can exactly equal or close to the price that the asset closed on.
Based on trends and market sentiment, speculative trading using CFDs involves predicting price movements. The doji candlestick is an important technical tool for speculative trading. It allows you to accurately predict whether the asset price will go up or down or whether there will be a bullish or bearish reversal.
Sometimes, the Doji patterns fail to indicate accurate reversals because traders do not use additional technical analysis tools and indicators to confirm the reversal. Like many other patterns, the Doji pattern hints at a possible reversal. It is always recommended to use various other metrics and tools to confirm whether the trend is true or whether there will be a possible bullish or bearish reversal.
Candlesticks and patterns are the cornerstone of technical analysis, and understanding and interpreting them effectively is the mark of a good financial analyst, trader, and investor. The Doji candle is a single candlestick pattern where the underlying asset’s open and close prices are equal or incredibly close to each other. This means that the price at which the asset (stocks, futures, bonds, etc.) opened somehow can exactly equal or close to the price that the asset closed on. The pattern is represented by a small candle length, meaning that the asset’s trading range was small and can have a long or short wick on either side. The length of the wick represents market volatility and is an important trait to interpret when making decisions.
A bullish Doji candlestick indicates a chance of a bullish reversal after a downtrend. On the other hand, a bearish Doji candlestick potentially indicates a possible bearish trend reversal in the chart. As a beginner trader, learning to spot and interpret such candlestick patterns is of utmost importance. We suggest using a demo account to first experience and practice their hand on different patterns before entering the real fluctuating world of financial trading and investment.
Step into the world of trading with confidence today. Open a free PU Prime live CFD trading account now to experience real-time market action, or refine your strategies risk-free with our demo account.
This content is for educational and informational purposes only and should not be considered investment advice, a personal recommendation, or an offer to buy or sell any financial instruments.
This material has been prepared without considering any individual investment objectives, financial situations. Any references to past performance of a financial instrument, index, or investment product are not indicative of future results.
PU Prime makes no representation as to the accuracy or completeness of this content and accepts no liability for any loss or damage arising from reliance on the information provided. Trading involves risk, and you should carefully consider your investment objectives and risk tolerance before making any trading decisions. Never invest more than you can afford to lose.

Trade forex, indices, metal, and more at industry-low spreads and lightning-fast execution.
Sign up for a PU Prime Live Account with our hassle-free process.
Effortlessly fund your account with a wide range of channels and accepted currencies.
Access hundreds of instruments under market-leading trading conditions.
Trading Platforms
Learn
About PU Prime
Corporate

Please note the Website is intended for individuals residing in jurisdictions where accessing the Website is permitted by law.
Please note that PU Prime and its affiliated entities are neither established nor operating in your home jurisdiction.
By clicking the "Acknowledge" button, you confirm that you are entering this website solely based on your initiative and not as a result of any specific marketing outreach. You wish to obtain information from this website which is provided on reverse solicitation in accordance with the laws of your home jurisdiction.
Thank You for Your Acknowledgement!
Ten en cuenta que el sitio web está destinado a personas que residen en jurisdicciones donde el acceso al sitio web está permitido por la ley.
Ten en cuenta que PU Prime y sus entidades afiliadas no están establecidas ni operan en tu jurisdicción de origen.
Al hacer clic en el botón "Aceptar", confirmas que estás ingresando a este sitio web por tu propia iniciativa y no como resultado de ningún esfuerzo de marketing específico. Deseas obtener información de este sitio web que se proporciona mediante solicitud inversa de acuerdo con las leyes de tu jurisdicción de origen.
Thank You for Your Acknowledgement!