-
- Trading Platforms
- PU Prime App
- MetaTrader 5
- MetaTrader 4
- PU Copy Trading
- Web Trader
- PU Social
-
- Trading Conditions
- Account Types
- Spreads, Costs & Swaps
- Deposits & Withdrawals
- Fee & Charges
- Trading Hours

The Chinese government introduced an economic stimulus package, including lowering their deposit rate as soon as mid-June. Meanwhile, the U.S. Secretary of State has planned to visit China, which may improve the bilateral relationship between the 2 nations. Regional stock indices including the HSI, Nikkei and Kospi, were stimulated by the optimistic measure and edged higher. On the other hand, the RBA surprised the market with a hike of 25 bps last night and boosted the Aussie dollar to gain more than 0.8% against USD. The RBA Governor explained that factors such as a rebounding housing market, strong wage gain, and persistent services inflation are testing the patience of RBA in getting inflation back to its target. Elsewhere, Regulatory concerns persist in the cryptocurrency market as the SEC accuses major exchanges like Binance and Coinbase of illegal operations.
Current rate hike bets on 14th June Fed interest rate decision:
Source: CME Fedwatch Tool
0 bps (81%) VS 25 bps (19%)


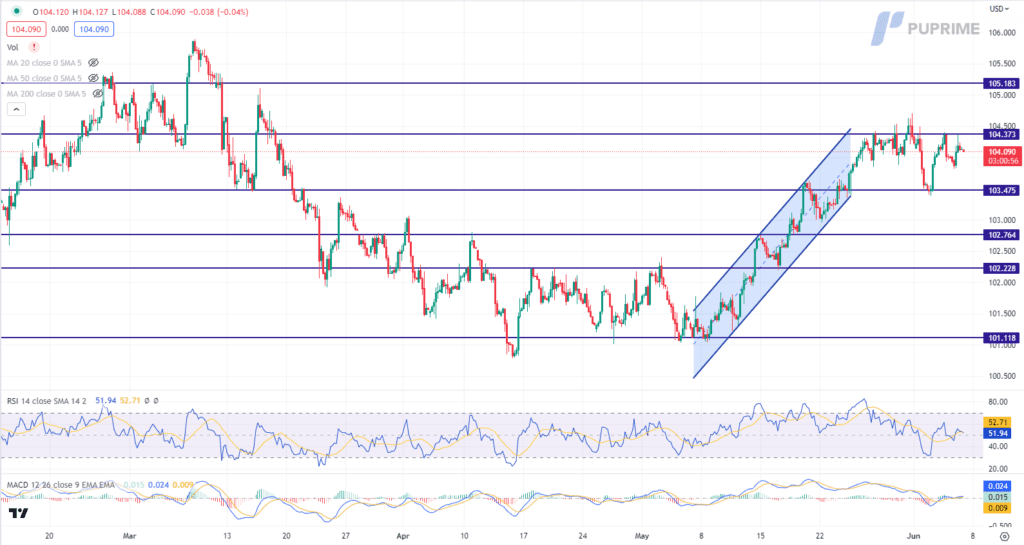
The Dollar Index rallied against a basket of major currencies, driven by growing expectations of an imminent rate hike by the Federal Reserve. However, the US Dollar’s overall trend remains near a critical resistance level, signalling potential challenges ahead. According to the CME Group’s FedWatch Tool, market sentiment suggests a 65% probability of a 25-basis point rate increase in July. The US economic data has presented a mixed picture, introducing additional uncertainties for investors. As a result, market participants must remain vigilant and closely monitor economic data to assess the likelihood of future monetary policy decisions by the Federal Reserve.
The Dollar Index is trading higher while currently near the resistance level. MACD has illustrated increasing bullish momentum, while RSI is at 52, suggesting the index might extend its gains after breakout since the RSI stays above the midline.
Resistance level: 104.35, 105.20
Support level: 103.45, 102.75
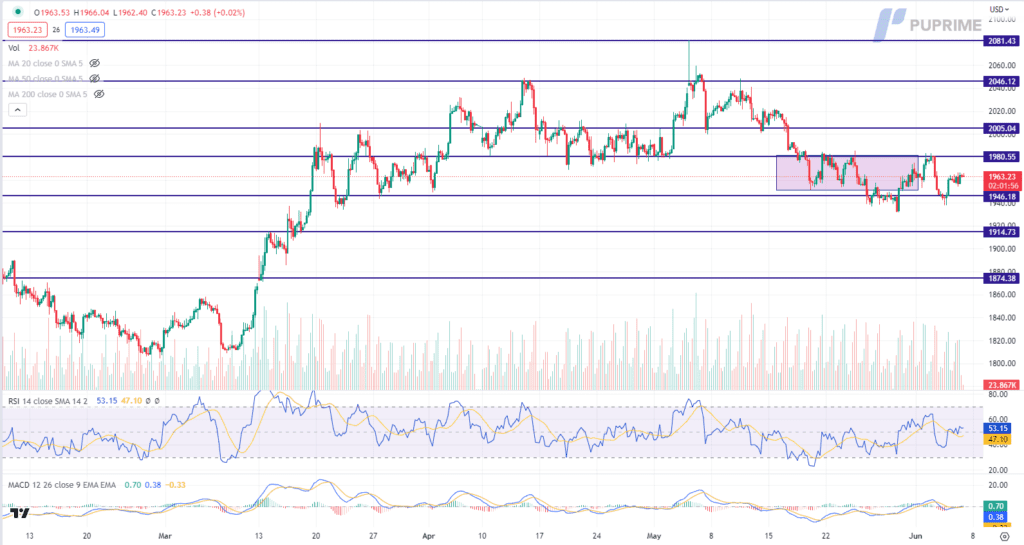
Gold prices staged a notable rebound, driven by technical corrections and a cautious approach adopted by investors ahead of several pivotal events. Market participants demonstrated a tendency to reallocate their portfolios towards safe-haven assets, seeking shelter amidst market uncertainties and awaiting additional market signals before making critical portfolio allocation decisions. With a keen eye on upcoming economic data releases and monetary policy decisions, investors remain poised to decipher these crucial factors that could provide valuable trading signals.
Gold prices are trading higher following the prior rebound from the support level. MACD has illustrated increasing bullish momentum, while RSI is at 53, suggesting the commodity might extend its gains toward resistance level since the RSI stays above the midline.
Resistance level: 1980.00, 2005.00
Support level: 1945.00, 1915.00
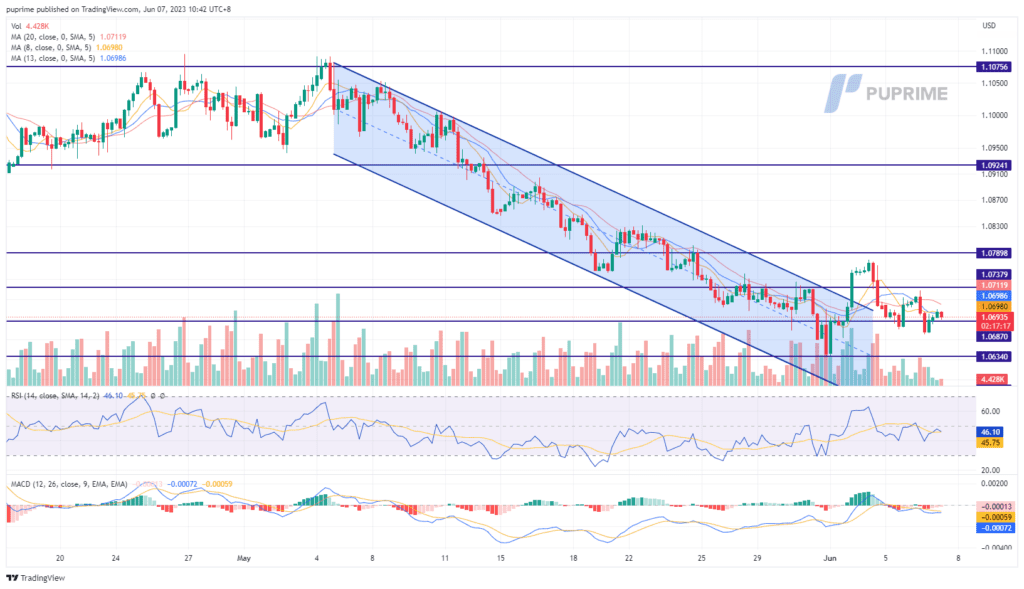
The pair left with little change, but the euro still traded sluggishly against the USD below 1.0700. Although it is almost certain that the ECB may raise interest rates by 25 bps next week, the market has priced and the impact of the move on the strength of the euro is minimal. On top of that, European economic data is rather disappointing, with the German manufacturing sector continuing to contract, which deepen the bearish sentiment of the euro. Amid the uncertainty in the equity markets, investors have the tendency to hold USD which provides strong support for the currency.
The price movement of EUR/USD is getting smaller, especially after the debt-limit bill is passed in the Senate. Both the RSI and MACD provided neutral signals for the pair.
Resistance level: 1.0717, 1.0789
Support level: 1.0634, 1.0588
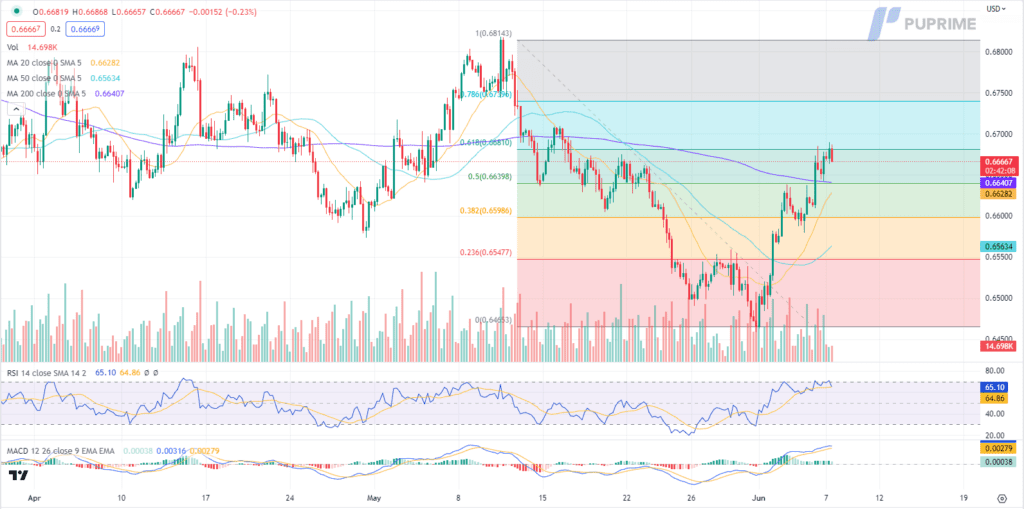
The Australian dollar surged to its highest level since mid-May following a decisive move by the Reserve Bank of Australia (RBA) to raise interest rates by a quarter-point. The central bank’s bold decision pushed the benchmark rate to an 11-year high of 4.1% and underscored the RBA’s commitment to reigniting inflation within its target range. This hawkish move by the RBA signals the potential for further tightening measures in the future, as policymakers seek to ensure sustainable economic growth and price stability.
AUD/USD is higher while currently testing the resistance level. However, MACD has illustrated diminishing bullish momentum, while RSI is at 65, suggesting the pair might enter oversold territory.
Resistance level: 0.6680, 0.6740
Support level: 0.6640, 0.6600
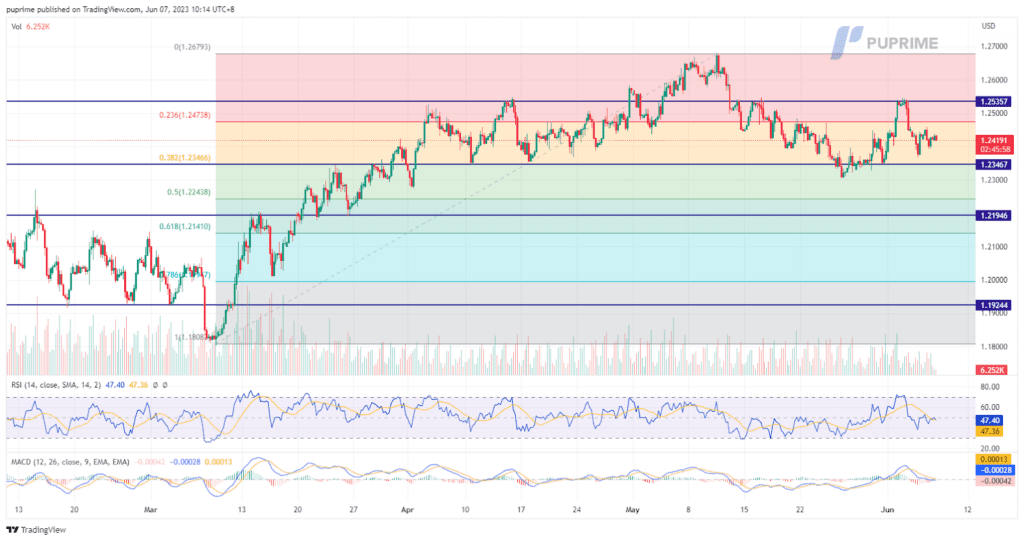
The pound experienced a decline in value following the survey data release indicating a slump in British house-building during May. The weaker construction activity was attributed to the challenges faced by construction companies due to rising interest rates. Despite an overall increase in the purchasing managers’ index (PMI) score for the construction sector, driven by growth in commercial and civil engineering activity, house building suffered. This divergence in the construction sector’s performance may impact the Bank of England’s decision on interest rates, with expectations of a potentially lower rate increase than previously anticipated by the markets. Currently, traders foresee a rise to approximately 5.4% later this year, compared to the current rate of 4.5%.
Both the RSI and MACD indicators are currently indicating a neutral momentum as of writing. This neutral momentum suggests market participants may be cautious and await further signals before making significant trading decisions.
Resistance level: 1.2475, 1.2535
Support level: 1.2345, 1.2195
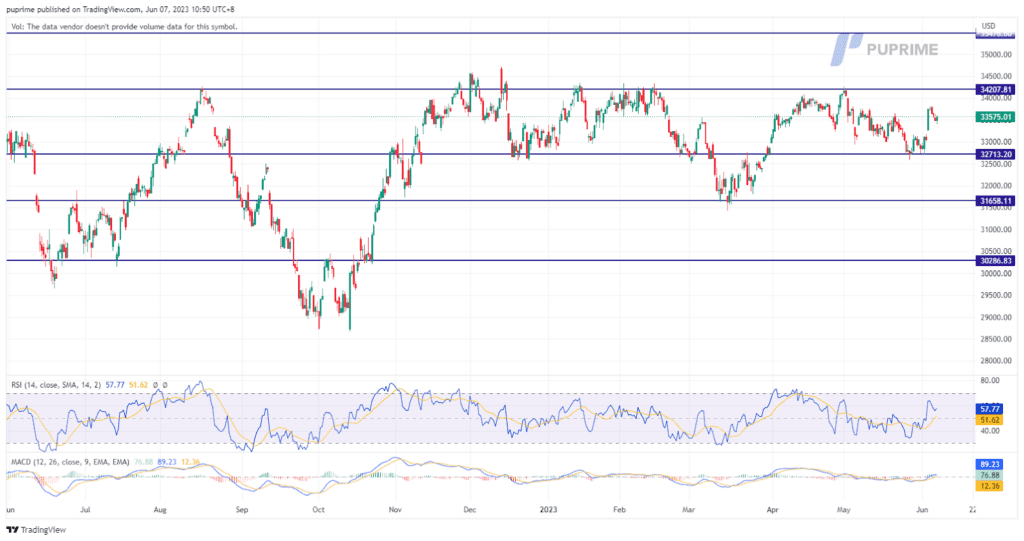
The Dow Jones Industrial Average experienced a minimal increase of 10.42 points, or 0.03%, reaching 33,573.28 on Tuesday. The likelihood of the Federal Reserve maintaining interest rates at its upcoming meeting was heightened by recent economic data and dovish statements from Fed officials. However, Coinbase Global (COIN.O) encountered a significant decline of 12.09% as it faced a lawsuit from the U.S. Securities and Exchange Commission (SEC) for allegedly operating without proper registration. Apple Inc (AAPL.O) also faced losses, slipping 0.21%, following the announcement of its expensive augmented-reality headset, the Vision Pro, which enters a market predominantly controlled by Meta (META.O).
Both the MACD and the RSI are currently signalling a neutral to slightly bullish momentum. These indicators reflect a cautious optimism among traders, as they anticipate potential upward price movements while maintaining a watchful stance.
Resistance level: 34207, 35476
Support level: 32713, 31658

Oil prices encountered downward pressure as concerns over sluggish global economic growth and tightening monetary policy expectations weighed on energy demand. Market participants remained cautious due to worries that these factors could hinder the overall oil consumption outlook. Despite Saudi Arabia’s pledge to deepen output cuts, analysts from Citi Bank expressed doubts about the effectiveness of such measures in achieving sustainable price increases, citing weak demand.
Oil prices are trading lower while currently testing the support level. MACD has illustrated diminishing bullish momentum, while RSI is at 53, suggesting the commodity might extend its losses after breakout since the RSI retreated sharply from overbought territory.
Resistance level: 74.20, 76.75
Support level: 71.00, 67.95
Step into the world of trading with confidence today. Open a free PU Prime live CFD trading account now to experience real-time market action, or refine your strategies risk-free with our demo account.
This content is for educational and informational purposes only and should not be considered investment advice, a personal recommendation, or an offer to buy or sell any financial instruments.
This material has been prepared without considering any individual investment objectives, financial situations. Any references to past performance of a financial instrument, index, or investment product are not indicative of future results.
PU Prime makes no representation as to the accuracy or completeness of this content and accepts no liability for any loss or damage arising from reliance on the information provided. Trading involves risk, and you should carefully consider your investment objectives and risk tolerance before making any trading decisions. Never invest more than you can afford to lose.

Trade forex, indices, metal, and more at industry-low spreads and lightning-fast execution.
Sign up for a PU Prime Live Account with our hassle-free process.
Effortlessly fund your account with a wide range of channels and accepted currencies.
Access hundreds of instruments under market-leading trading conditions.
Please note the Website is intended for individuals residing in jurisdictions where accessing the Website is permitted by law.
Please note that PU Prime and its affiliated entities are neither established nor operating in your home jurisdiction.
By clicking the "Acknowledge" button, you confirm that you are entering this website solely based on your initiative and not as a result of any specific marketing outreach. You wish to obtain information from this website which is provided on reverse solicitation in accordance with the laws of your home jurisdiction.
Thank You for Your Acknowledgement!
Ten en cuenta que el sitio web está destinado a personas que residen en jurisdicciones donde el acceso al sitio web está permitido por la ley.
Ten en cuenta que PU Prime y sus entidades afiliadas no están establecidas ni operan en tu jurisdicción de origen.
Al hacer clic en el botón "Aceptar", confirmas que estás ingresando a este sitio web por tu propia iniciativa y no como resultado de ningún esfuerzo de marketing específico. Deseas obtener información de este sitio web que se proporciona mediante solicitud inversa de acuerdo con las leyes de tu jurisdicción de origen.
Thank You for Your Acknowledgement!

The Chinese government introduced an economic stimulus package, including lowering their deposit rate as soon as mid-June. Meanwhile, the U.S. Secretary of State has planned to visit China, which may improve the bilateral relationship between the 2 nations. Regional stock indices including the HSI, Nikkei and Kospi, were stimulated by the optimistic measure and edged higher. On the other hand, the RBA surprised the market with a hike of 25 bps last night and boosted the Aussie dollar to gain more than 0.8% against USD. The RBA Governor explained that factors such as a rebounding housing market, strong wage gain, and persistent services inflation are testing the patience of RBA in getting inflation back to its target. Elsewhere, Regulatory concerns persist in the cryptocurrency market as the SEC accuses major exchanges like Binance and Coinbase of illegal operations.
Current rate hike bets on 14th June Fed interest rate decision:
Source: CME Fedwatch Tool
0 bps (81%) VS 25 bps (19%)


The Dollar Index rallied against a basket of major currencies, driven by growing expectations of an imminent rate hike by the Federal Reserve. However, the US Dollar’s overall trend remains near a critical resistance level, signalling potential challenges ahead. According to the CME Group’s FedWatch Tool, market sentiment suggests a 65% probability of a 25-basis point rate increase in July. The US economic data has presented a mixed picture, introducing additional uncertainties for investors. As a result, market participants must remain vigilant and closely monitor economic data to assess the likelihood of future monetary policy decisions by the Federal Reserve.
The Dollar Index is trading higher while currently near the resistance level. MACD has illustrated increasing bullish momentum, while RSI is at 52, suggesting the index might extend its gains after breakout since the RSI stays above the midline.
Resistance level: 104.35, 105.20
Support level: 103.45, 102.75

Gold prices staged a notable rebound, driven by technical corrections and a cautious approach adopted by investors ahead of several pivotal events. Market participants demonstrated a tendency to reallocate their portfolios towards safe-haven assets, seeking shelter amidst market uncertainties and awaiting additional market signals before making critical portfolio allocation decisions. With a keen eye on upcoming economic data releases and monetary policy decisions, investors remain poised to decipher these crucial factors that could provide valuable trading signals.
Gold prices are trading higher following the prior rebound from the support level. MACD has illustrated increasing bullish momentum, while RSI is at 53, suggesting the commodity might extend its gains toward resistance level since the RSI stays above the midline.
Resistance level: 1980.00, 2005.00
Support level: 1945.00, 1915.00

The pair left with little change, but the euro still traded sluggishly against the USD below 1.0700. Although it is almost certain that the ECB may raise interest rates by 25 bps next week, the market has priced and the impact of the move on the strength of the euro is minimal. On top of that, European economic data is rather disappointing, with the German manufacturing sector continuing to contract, which deepen the bearish sentiment of the euro. Amid the uncertainty in the equity markets, investors have the tendency to hold USD which provides strong support for the currency.
The price movement of EUR/USD is getting smaller, especially after the debt-limit bill is passed in the Senate. Both the RSI and MACD provided neutral signals for the pair.
Resistance level: 1.0717, 1.0789
Support level: 1.0634, 1.0588

The Australian dollar surged to its highest level since mid-May following a decisive move by the Reserve Bank of Australia (RBA) to raise interest rates by a quarter-point. The central bank’s bold decision pushed the benchmark rate to an 11-year high of 4.1% and underscored the RBA’s commitment to reigniting inflation within its target range. This hawkish move by the RBA signals the potential for further tightening measures in the future, as policymakers seek to ensure sustainable economic growth and price stability.
AUD/USD is higher while currently testing the resistance level. However, MACD has illustrated diminishing bullish momentum, while RSI is at 65, suggesting the pair might enter oversold territory.
Resistance level: 0.6680, 0.6740
Support level: 0.6640, 0.6600

The pound experienced a decline in value following the survey data release indicating a slump in British house-building during May. The weaker construction activity was attributed to the challenges faced by construction companies due to rising interest rates. Despite an overall increase in the purchasing managers’ index (PMI) score for the construction sector, driven by growth in commercial and civil engineering activity, house building suffered. This divergence in the construction sector’s performance may impact the Bank of England’s decision on interest rates, with expectations of a potentially lower rate increase than previously anticipated by the markets. Currently, traders foresee a rise to approximately 5.4% later this year, compared to the current rate of 4.5%.
Both the RSI and MACD indicators are currently indicating a neutral momentum as of writing. This neutral momentum suggests market participants may be cautious and await further signals before making significant trading decisions.
Resistance level: 1.2475, 1.2535
Support level: 1.2345, 1.2195

The Dow Jones Industrial Average experienced a minimal increase of 10.42 points, or 0.03%, reaching 33,573.28 on Tuesday. The likelihood of the Federal Reserve maintaining interest rates at its upcoming meeting was heightened by recent economic data and dovish statements from Fed officials. However, Coinbase Global (COIN.O) encountered a significant decline of 12.09% as it faced a lawsuit from the U.S. Securities and Exchange Commission (SEC) for allegedly operating without proper registration. Apple Inc (AAPL.O) also faced losses, slipping 0.21%, following the announcement of its expensive augmented-reality headset, the Vision Pro, which enters a market predominantly controlled by Meta (META.O).
Both the MACD and the RSI are currently signalling a neutral to slightly bullish momentum. These indicators reflect a cautious optimism among traders, as they anticipate potential upward price movements while maintaining a watchful stance.
Resistance level: 34207, 35476
Support level: 32713, 31658

Oil prices encountered downward pressure as concerns over sluggish global economic growth and tightening monetary policy expectations weighed on energy demand. Market participants remained cautious due to worries that these factors could hinder the overall oil consumption outlook. Despite Saudi Arabia’s pledge to deepen output cuts, analysts from Citi Bank expressed doubts about the effectiveness of such measures in achieving sustainable price increases, citing weak demand.
Oil prices are trading lower while currently testing the support level. MACD has illustrated diminishing bullish momentum, while RSI is at 53, suggesting the commodity might extend its losses after breakout since the RSI retreated sharply from overbought territory.
Resistance level: 74.20, 76.75
Support level: 71.00, 67.95

Trade forex, indices, metal, and more at industry-low spreads and lightning-fast execution.
Sign up for a PU Prime Live Account with our hassle-free process.
Effortlessly fund your account with a wide range of channels and accepted currencies.
Access hundreds of instruments under market-leading trading conditions.
Sign up for a PU Prime Live Account with our hassle-free process.
Effortlessly fund your account with a wide range of channels and accepted currencies.
Access hundreds of instruments under market-leading trading conditions.