


-
- Trading Platforms
- PU Prime App
- MetaTrader 5
- MetaTrader 4
- PU Copy Trading
- Web Trader
- PU Social
-
- Trading Conditions
- Account Types
- Spreads, Costs & Swaps
- Deposits & Withdrawals
- Fee & Charges
- Trading Hours


EN
15 April 2025,04:40
Daily Market Analysis
15 April 2025, 04:40


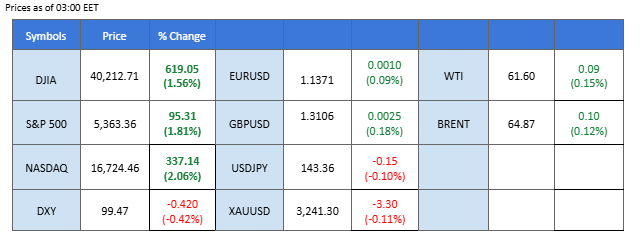
Market Summary
Markets remain gripped by volatility as U.S.-China trade tensions intensify. Washington’s imposition of 145% tariffs met with a 125% retaliation from Beijing, effectively freezing bilateral trade and triggering broad risk-off sentiment globally. Confusion deepens as the U.S. mixes temporary tech exemptions with fresh threats—particularly aimed at semiconductors—shaking investor confidence.
Safe-haven demand surged: gold pierced the $3,000/oz milestone, while the Japanese Yen and Swiss Franc climbed to multi-month highs. Meanwhile, Bitcoin’s status as a risk hedge remained shaky, hovering between $74K and $85K. Risk assets suffered as the S&P 500 dropped 4.3% this month, with tech names like Apple and Nvidia under pressure amid tariff uncertainty. The Dollar Index fell to 99.44, its lowest since July 2023, driven by rising expectations of Fed rate cuts and a lack of clarity on trade direction. Major currencies like GBP and EUR rallied on dollar weakness.
Geopolitically, Chinese President Xi Jinping’s diplomatic push across Southeast Asia signals a strategic pivot, strengthening regional ties with countries like Malaysia, Vietnam, and Indonesia. This could reduce China’s reliance on Western markets and counter U.S. efforts to economically isolate Beijing. As Xi remains silent on the latest tariffs, investors interpret the move as either strategic patience or a shift in focus to regional alliances.
Current rate hike bets on 7th May Fed interest rate decision:
Source: CME Fedwatch Tool
0 bps (85%) VS -25 bps (15%)
Market Overview
Economic Calendar
(MT4 System Time)
N/A
Source: MQL5
Market Movements

The U.S. Dollar Index remained largely flat after touching a three-year low, as investor sentiment was weighed down by President Donald Trump’s erratic tariff policies, which continue to cast doubt on the U.S. economic outlook. Federal Reserve Governor Christopher Waller noted that these tariffs pose a significant economic risk that may prompt the Fed to cut interest rates—even if inflation stays elevated—to avoid a recession. For now, trade war developments have slowed, with Chinese President Xi Jinping touring Southeast Asia in a bid to strengthen regional partnerships. Investors remain cautious, watching for any new updates that could influence dollar movements
The Dollar Index is trading lower while currently testing the support level. MACD has illustrated increasing bearish momentum, while RSI is at 30, suggesting the index might extend losses after breakout since the RSI stays below the midline.
Resistance level: 102.95, 106.80
Support level: 99.65, 95.85

Gold prices pulled back as easing trade tensions led to profit-taking on record-high safe-haven demand. The lack of fresh escalation and Trump’s suggestion of exemptions on auto-related tariffs have eased concerns for now. Although the U.S. has imposed a 145% tariff on Chinese goods, China has yet to respond, signaling possible internal discussions and a more measured approach. This shift has prompted some investors to rotate out of gold as immediate geopolitical risks appear to fade.
Gold prices are trading lower following the prior retracement from the resistance level. MACD has illustrated increasing bearish momentum, while RSI is at 65, suggesting the commodity might enter overbought territory.
Resistance level: 3220.00, 3290.00
Support level: 3165.00, 3130.00

The British pound continues to gain against the U.S. dollar as broad-based USD weakness and strong domestic data buoy sentiment. The Dollar Index (DXY) slipped to 99.01, a near three-year low, as stagflation risks mount. UK growth also surprised to the upside, with February GDP rising 0.5% MoM—well above consensus—driven by strength in manufacturing and services. However, markets are still pricing in 85 bps of BoE cuts in 2025, which could weigh on sterling should UK data soften.
GBP/USD remains in a firm uptrend. The pair has rallied sharply from the 1.2700 region, driven by broad USD weakness and bullish sentiment. Momentum indicators suggest strength but also caution; the RSI is at 67, approaching overbought territory while the MACD remains in bullish alignment, with the MACD line above the signal line and positive histogram bars, though momentum is starting to fade slightly as histogram bars shrink.
Resistance level: 1.3175, 1.3260
Support level: 1.3085, 1.3010

EUR/USD has surged to a 26-month high as broad dollar weakness, driven by softer U.S. data and dovish Fed signals, fuels euro demand. With CPI easing to 2.4% YoY and markets pricing 100bps of Fed cuts in 2025, the DXY is down 5% YTD. ECB rate cut expectations are largely priced in ahead of the April 18 meeting, shifting focus to Lagarde’s guidance.
EUR/USD has pulled back slightly after testing resistance at 1.1430, with momentum indicators signaling some cooling in bullish momentum. The RSI has dropped from overbought levels to 59, suggesting a loss of upside momentum but still within bullish territory. The MACD histogram has turned negative, hinting at a possible bearish divergence and short-term correction. Overall, the trend remains upward in the medium term, but near-term technicals suggest a pause or pullback before another leg higher.
Resistance level: 1.1430, 1.1540
Support level: 1.1285, 1.1190

Oil prices were little changed, reflecting mixed market sentiment. On the bullish side, China’s crude oil imports in March rebounded by nearly 5% year-on-year, supported by increased flows from Iran and Russia. However, upside momentum was capped by dimming global demand forecasts. Analysts from Goldman Sachs see Q4 2025 demand growth rising by just 300,000 barrels per day, while UBS slashed its Brent forecast by $12 to $68, and WTI to $64. JPMorgan also revised down its oil projections for 2025, citing rising OPEC+ supply and weaker petrochemical demand.
Crude oil prices are trading higher while currently near the resistance level. MACD has illustrated increasing bullish momentum, while RSI is at 53, suggesting the commodity might extend its gains since the RSI stays above the midline.
Resistance level: 62.75, 66.20
Support level: 59.15, 56.65

The Japanese yen remains supported as investors adopt a cautious stance following the Trump administration’s decision to implement a 90-day pause on new tariffs and signal a willingness to re-engage in trade negotiations. The move has left markets in a holding pattern, with traders wary of potential policy shifts from the newly inaugurated U.S. president. Despite the yen’s resilience, improving risk sentiment—evident in recent gains across U.S. equities and digital assets—could weigh on demand for haven currencies. A sustained break above the 144.30 level in USD/JPY may be viewed as a signal of bullish momentum and a potential trend reversal for the pair.
USD/JPY is now trading in a higher-high pattern after the pair dipped to a new low in 2025, suggesting a potential technical rebound ahead. The RSI remains below the 50 level, while the MACD has formed a golden cross at the bottom—indicating that the pair continues to trade with underlying bearish momentum.
Resistance level: 145.20, 147.60
Support level: 141.90, 140.40

The Australian dollar is riding a risk-on rebound and firmer commodity sentiment. Positive risk sentiment followed temporary U.S. tech tariff exemptions, lifting equities and cyclical currencies. Iron ore prices have also steadied, as Beijing resists a full-blown trade decoupling, suggesting latent demand support. However, the RBA’s dovish stance—markets expect rate cuts in the second half of 2025—has capped upside momentum. AUD remains vulnerable to renewed U.S.-China friction or a commodity downturn.
AUD/USD is consolidating near resistance at 0.6368 after a strong bullish rebound from the 0.6020 handle earlier this month. The RSI sits at 66, near overbought levels, indicating that bullish momentum is still present but could be slowing as the pair approaches a key resistance zone. The MACD remains in positive territory, with the MACD line above the signal line, though the histogram is starting to fade, suggesting a potential weakening of bullish momentum.
Resistance level: 0.6368, 0.6450
Support level: 0.6270, 0.6210

The U.S. equity market remained flat, mirroring the cautious sentiment seen globally amid uncertainty over the trade war’s trajectory. Major investment firms, including Barclays and JPMorgan, have expressed difficulty in forecasting equity trends under the current volatile backdrop. With no new market-moving catalysts at present, investors appear to be in wait-and-see mode, reluctant to commit until clearer direction emerges.
The Dow is trading higher while currently testing the resistance level. MACD has illustrated diminishing bearish momentum, while RSI is at 47, suggesting the index might extend its gains since the RSI rebounded from oversold territory.
Resistance level: 40640.00, 42035.00
Support level: 38760.00, 37195.00
Step into the world of trading with confidence today. Open a free PU Prime live CFD trading account now to experience real-time market action, or refine your strategies risk-free with our demo account.
This content is for educational and informational purposes only and should not be considered investment advice, a personal recommendation, or an offer to buy or sell any financial instruments.
This material has been prepared without considering any individual investment objectives, financial situations. Any references to past performance of a financial instrument, index, or investment product are not indicative of future results.
PU Prime makes no representation as to the accuracy or completeness of this content and accepts no liability for any loss or damage arising from reliance on the information provided. Trading involves risk, and you should carefully consider your investment objectives and risk tolerance before making any trading decisions. Never invest more than you can afford to lose.

Trade forex, indices, metal, and more at industry-low spreads and lightning-fast execution.
Sign up for a PU Prime Live Account with our hassle-free process.
Effortlessly fund your account with a wide range of channels and accepted currencies.
Access hundreds of instruments under market-leading trading conditions.
Trading Platforms
Learn
About PU Prime
Corporate

Please note the Website is intended for individuals residing in jurisdictions where accessing the Website is permitted by law.
Please note that PU Prime and its affiliated entities are neither established nor operating in your home jurisdiction.
By clicking the "Acknowledge" button, you confirm that you are entering this website solely based on your initiative and not as a result of any specific marketing outreach. You wish to obtain information from this website which is provided on reverse solicitation in accordance with the laws of your home jurisdiction.
Thank You for Your Acknowledgement!
Ten en cuenta que el sitio web está destinado a personas que residen en jurisdicciones donde el acceso al sitio web está permitido por la ley.
Ten en cuenta que PU Prime y sus entidades afiliadas no están establecidas ni operan en tu jurisdicción de origen.
Al hacer clic en el botón "Aceptar", confirmas que estás ingresando a este sitio web por tu propia iniciativa y no como resultado de ningún esfuerzo de marketing específico. Deseas obtener información de este sitio web que se proporciona mediante solicitud inversa de acuerdo con las leyes de tu jurisdicción de origen.
Thank You for Your Acknowledgement!
15 April 2025,04:40
Daily Market Analysis
15 April 2025, 04:40
Market Summary
Markets remain gripped by volatility as U.S.-China trade tensions intensify. Washington’s imposition of 145% tariffs met with a 125% retaliation from Beijing, effectively freezing bilateral trade and triggering broad risk-off sentiment globally. Confusion deepens as the U.S. mixes temporary tech exemptions with fresh threats—particularly aimed at semiconductors—shaking investor confidence.
Safe-haven demand surged: gold pierced the $3,000/oz milestone, while the Japanese Yen and Swiss Franc climbed to multi-month highs. Meanwhile, Bitcoin’s status as a risk hedge remained shaky, hovering between $74K and $85K. Risk assets suffered as the S&P 500 dropped 4.3% this month, with tech names like Apple and Nvidia under pressure amid tariff uncertainty. The Dollar Index fell to 99.44, its lowest since July 2023, driven by rising expectations of Fed rate cuts and a lack of clarity on trade direction. Major currencies like GBP and EUR rallied on dollar weakness.
Geopolitically, Chinese President Xi Jinping’s diplomatic push across Southeast Asia signals a strategic pivot, strengthening regional ties with countries like Malaysia, Vietnam, and Indonesia. This could reduce China’s reliance on Western markets and counter U.S. efforts to economically isolate Beijing. As Xi remains silent on the latest tariffs, investors interpret the move as either strategic patience or a shift in focus to regional alliances.
Current rate hike bets on 7th May Fed interest rate decision:
Source: CME Fedwatch Tool
0 bps (85%) VS -25 bps (15%)
Market Overview
Economic Calendar
(MT4 System Time)
N/A
Source: MQL5
Market Movements
The U.S. Dollar Index remained largely flat after touching a three-year low, as investor sentiment was weighed down by President Donald Trump’s erratic tariff policies, which continue to cast doubt on the U.S. economic outlook. Federal Reserve Governor Christopher Waller noted that these tariffs pose a significant economic risk that may prompt the Fed to cut interest rates—even if inflation stays elevated—to avoid a recession. For now, trade war developments have slowed, with Chinese President Xi Jinping touring Southeast Asia in a bid to strengthen regional partnerships. Investors remain cautious, watching for any new updates that could influence dollar movements
The Dollar Index is trading lower while currently testing the support level. MACD has illustrated increasing bearish momentum, while RSI is at 30, suggesting the index might extend losses after breakout since the RSI stays below the midline.
Resistance level: 102.95, 106.80
Support level: 99.65, 95.85
Gold prices pulled back as easing trade tensions led to profit-taking on record-high safe-haven demand. The lack of fresh escalation and Trump’s suggestion of exemptions on auto-related tariffs have eased concerns for now. Although the U.S. has imposed a 145% tariff on Chinese goods, China has yet to respond, signaling possible internal discussions and a more measured approach. This shift has prompted some investors to rotate out of gold as immediate geopolitical risks appear to fade.
Gold prices are trading lower following the prior retracement from the resistance level. MACD has illustrated increasing bearish momentum, while RSI is at 65, suggesting the commodity might enter overbought territory.
Resistance level: 3220.00, 3290.00
Support level: 3165.00, 3130.00
The British pound continues to gain against the U.S. dollar as broad-based USD weakness and strong domestic data buoy sentiment. The Dollar Index (DXY) slipped to 99.01, a near three-year low, as stagflation risks mount. UK growth also surprised to the upside, with February GDP rising 0.5% MoM—well above consensus—driven by strength in manufacturing and services. However, markets are still pricing in 85 bps of BoE cuts in 2025, which could weigh on sterling should UK data soften.
GBP/USD remains in a firm uptrend. The pair has rallied sharply from the 1.2700 region, driven by broad USD weakness and bullish sentiment. Momentum indicators suggest strength but also caution; the RSI is at 67, approaching overbought territory while the MACD remains in bullish alignment, with the MACD line above the signal line and positive histogram bars, though momentum is starting to fade slightly as histogram bars shrink.
Resistance level: 1.3175, 1.3260
Support level: 1.3085, 1.3010
EUR/USD has surged to a 26-month high as broad dollar weakness, driven by softer U.S. data and dovish Fed signals, fuels euro demand. With CPI easing to 2.4% YoY and markets pricing 100bps of Fed cuts in 2025, the DXY is down 5% YTD. ECB rate cut expectations are largely priced in ahead of the April 18 meeting, shifting focus to Lagarde’s guidance.
EUR/USD has pulled back slightly after testing resistance at 1.1430, with momentum indicators signaling some cooling in bullish momentum. The RSI has dropped from overbought levels to 59, suggesting a loss of upside momentum but still within bullish territory. The MACD histogram has turned negative, hinting at a possible bearish divergence and short-term correction. Overall, the trend remains upward in the medium term, but near-term technicals suggest a pause or pullback before another leg higher.
Resistance level: 1.1430, 1.1540
Support level: 1.1285, 1.1190
Oil prices were little changed, reflecting mixed market sentiment. On the bullish side, China’s crude oil imports in March rebounded by nearly 5% year-on-year, supported by increased flows from Iran and Russia. However, upside momentum was capped by dimming global demand forecasts. Analysts from Goldman Sachs see Q4 2025 demand growth rising by just 300,000 barrels per day, while UBS slashed its Brent forecast by $12 to $68, and WTI to $64. JPMorgan also revised down its oil projections for 2025, citing rising OPEC+ supply and weaker petrochemical demand.
Crude oil prices are trading higher while currently near the resistance level. MACD has illustrated increasing bullish momentum, while RSI is at 53, suggesting the commodity might extend its gains since the RSI stays above the midline.
Resistance level: 62.75, 66.20
Support level: 59.15, 56.65
The Japanese yen remains supported as investors adopt a cautious stance following the Trump administration’s decision to implement a 90-day pause on new tariffs and signal a willingness to re-engage in trade negotiations. The move has left markets in a holding pattern, with traders wary of potential policy shifts from the newly inaugurated U.S. president. Despite the yen’s resilience, improving risk sentiment—evident in recent gains across U.S. equities and digital assets—could weigh on demand for haven currencies. A sustained break above the 144.30 level in USD/JPY may be viewed as a signal of bullish momentum and a potential trend reversal for the pair.
USD/JPY is now trading in a higher-high pattern after the pair dipped to a new low in 2025, suggesting a potential technical rebound ahead. The RSI remains below the 50 level, while the MACD has formed a golden cross at the bottom—indicating that the pair continues to trade with underlying bearish momentum.
Resistance level: 145.20, 147.60
Support level: 141.90, 140.40
The Australian dollar is riding a risk-on rebound and firmer commodity sentiment. Positive risk sentiment followed temporary U.S. tech tariff exemptions, lifting equities and cyclical currencies. Iron ore prices have also steadied, as Beijing resists a full-blown trade decoupling, suggesting latent demand support. However, the RBA’s dovish stance—markets expect rate cuts in the second half of 2025—has capped upside momentum. AUD remains vulnerable to renewed U.S.-China friction or a commodity downturn.
AUD/USD is consolidating near resistance at 0.6368 after a strong bullish rebound from the 0.6020 handle earlier this month. The RSI sits at 66, near overbought levels, indicating that bullish momentum is still present but could be slowing as the pair approaches a key resistance zone. The MACD remains in positive territory, with the MACD line above the signal line, though the histogram is starting to fade, suggesting a potential weakening of bullish momentum.
Resistance level: 0.6368, 0.6450
Support level: 0.6270, 0.6210
The U.S. equity market remained flat, mirroring the cautious sentiment seen globally amid uncertainty over the trade war’s trajectory. Major investment firms, including Barclays and JPMorgan, have expressed difficulty in forecasting equity trends under the current volatile backdrop. With no new market-moving catalysts at present, investors appear to be in wait-and-see mode, reluctant to commit until clearer direction emerges.
The Dow is trading higher while currently testing the resistance level. MACD has illustrated diminishing bearish momentum, while RSI is at 47, suggesting the index might extend its gains since the RSI rebounded from oversold territory.
Resistance level: 40640.00, 42035.00
Support level: 38760.00, 37195.00
Trade forex, indices, metal, and more at industry-low spreads and lightning-fast execution.
Sign up for a PU Prime Live Account with our hassle-free process.
Effortlessly fund your account with a wide range of channels and accepted currencies.
Access hundreds of instruments under market-leading trading conditions.
Sign up for a PU Prime Live Account with our hassle-free process.
Effortlessly fund your account with a wide range of channels and accepted currencies.
Access hundreds of instruments under market-leading trading conditions.