


-
- Trading Platforms
- PU Prime App
- MetaTrader 5
- MetaTrader 4
- PU Copy Trading
- Web Trader
- PU Social
-
- Trading Conditions
- Account Types
- Spreads, Costs & Swaps
- Deposits & Withdrawals
- Fee & Charges
- Trading Hours


EN
20 February 2025,08:13
IntermediateTechnical Analysis
20 February 2025, 08:13

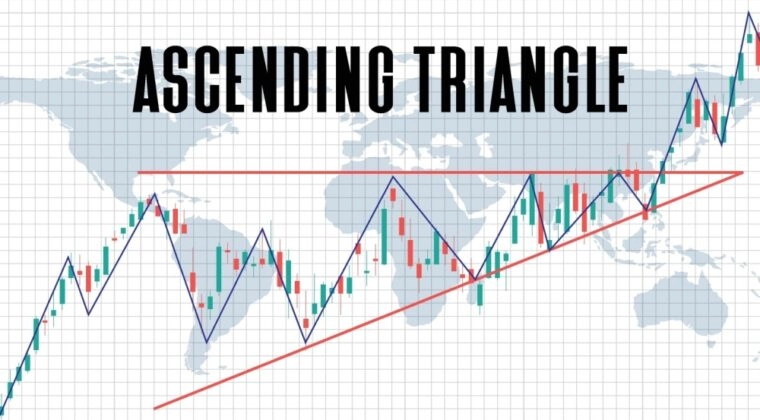
Chart patterns play a pivotal role in technical analysis, offering traders a visual framework for identifying potential market momentum shifts. Among the many patterns tracked by analysts, the ascending triangle is especially noteworthy for indicating a likely continuation of bullish trends. Yet, despite its strong reputation, the pattern does not always behave as expected. When breakouts fail to materialise or quickly reverse, traders are confronted with a failed ascending triangle pattern. This is a scenario that can carry important implications for future price action.
Understanding the dynamics of both successful and failed ascending triangles is essential for traders aiming to navigate the complexities of today’s financial markets. By recognising these patterns and their variations, traders can make informed decisions, manage risk effectively, and adapt their strategies to changing conditions.
An ascending triangle is a commonly recognised chart formation in technical analysis that typically indicates a bullish continuation. It forms when a market’s price action creates a horizontal resistance line at the top and a rising trendline underneath. Each time price nears the top boundary, it struggles to break higher but retreats to a higher low creating the characteristic ascending support line.
Ascending triangles are classed as a continuation pattern. In an established uptrend, the pattern often signals strong upside momentum if price eventually closes above the horizontal resistance on higher-than-usual volume. Traders watch for this breakout, interpreting it as a sign that buyers have overcome the selling pressure at the resistance line.However, like all technical patterns, ascending triangles are not foolproof. A seemingly perfect formation can result in a failed ascending triangle pattern if price fails to break above resistance or if the breakout lacks follow-through.
Despite the ascending triangle’s reputation as a reliable continuation pattern, it can still break down in unexpected ways. In a failed ascending triangle pattern, the anticipated bullish breakout never fully materialises, or if it does, it quickly reverses. Several factors can contribute to this scenario:
By recognising these triggers, traders can better prepare for potential downside scenarios.
The ascending triangle pattern is more than just a technical formation on a chart—it represents a battle between buyers and sellers and reveals important clues about market psychology.
As the price forms higher lows, it reflects increasing confidence among buyers. Each time the price pulls back, buyers are willing to step in earlier, believing the asset is undervalued at progressively higher levels.
This behaviour creates the upward-sloping trendline that underpins the ascending triangle, signalling growing demand and optimism.
The horizontal resistance line shows that sellers remain active at a specific price level, preventing the market from breaking higher. This resistance often represents a psychological barrier, such as a prior high, where many traders anticipate a reversal.
Sellers’ resolve can weaken over time if buying pressure intensifies, leading to the eventual breakout.
As the pattern progresses, the space between the resistance line and the rising trendline narrows, creating tension. This reflects a build-up of momentum as buyers and sellers prepare for a decisive move.
The final breakout (or breakdown) is often explosive, as one side dominates and the price reacts accordingly.
When an ascending triangle fails, it often indicates a shift in sentiment. Buyers may lose confidence due to external factors like negative news or weak volume, causing the pattern to collapse.
Conversely, sellers may reassert control if the resistance level is perceived as too strong, leading to a breakdown instead of a breakout.
Spotting an ascending triangle on a price chart requires careful observation of both horizontal resistance and rising support.
Imagine a major commodity such as gold trading near a long-term resistance level of £1,900 per ounce. Over several weeks, gold’s price fails to surpass this threshold, creating a horizontal line of resistance. Meanwhile, the low points of each consolidation are forming ever-higher troughs—£1,850, then £1,870, and so on—indicating increasing buying interest. Charting these higher lows reveals a rising support line, producing a classic ascending triangle formation.
Using trading programs, it is possible to track historical price data and overlay technical indicators to confirm whether volume and momentum align with a potential breakout. By identifying these key elements, traders gain better insight into the likelihood of a sustained bullish move.
A failed ascending triangle occurs when the anticipated bullish breakout either does not materialise or quickly reverses course. Recognising the tell-tale signs of a failure is crucial for traders aiming to avoid unnecessary losses and adapt their strategies promptly.
Consider a forex pair like GBP/USD forming an ascending triangle with a horizontal resistance around 1.3100. After several failed attempts to close above 1.3100, the pair briefly rallies to 1.3120 on lacklustre volume. Soon after, it plummets back below 1.3100 and breaches its rising trendline around 1.3050. The move is accompanied by a surge in selling volume, confirming a failed ascending triangle.
Using a platform like PU Prime, traders can overlay volume indicators and use real-time price alerts to spot such false breakouts in progress. By identifying the abrupt drop below the support line or the rapid return under resistance, traders gain a strong signal that the previously bullish scenario is no longer valid.
When an ascending triangle fails, the consequences for market sentiment and price direction can be significant. Rather than continuing to trend higher, the failed breakout or sudden breakdown often signals a shift in control from buyers to sellers.
Utilising comprehensive platforms, such as those offered by PU Prime, allows traders to quickly recognise a shift in momentum. By setting price alerts, monitoring real-time volume data, and using customisable charting tools, traders can better interpret whether a failed ascending triangle is likely to lead to a full-fledged downtrend or a drawn-out consolidation phase.
Even though ascending triangles are often seen as bullish continuation patterns, it is important to have strategies in place for both successful and failed breakouts.
Regardless of whether the ascending triangle meets or defies expectations, risk management is paramount. Tools that offer stop-loss settings, advanced charting features, and real-time volume data allow traders to monitor the market more effectively. Focus on keeping a clear head and well-defined rules for entering and exiting trades. This is especially the case in volatile conditions where sentiment can flip rapidly.
While ascending triangles can provide valuable insights, relying on this single chart pattern carries inherent risks. A comprehensive trading approach requires awareness of the potential pitfalls:
Traders can benefit from advanced charting tools to cross-verify potential breakout scenarios. Features like multiple chart overlays and technical studies help confirm whether an ascending triangle aligns with broader market signals. By combining various indicators and carefully managing your position size, you can guard against the inherent limitations of relying on a single pattern.
Ascending triangle patterns, including their failed variations, occur in multiple asset classes. Their core principles (horizontal resistance, rising support, and the potential for a breakout) apply whether you’re trading forex, stock indices, commodities, or other instruments.
Because PU Prime enables the trading of CFDs across a range of global markets (forex, indices, commodities, and shares) the ascending triangle pattern (and its potential failure) can be applied consistently. With real-time data, customisable chart overlays, and advanced analytical tools, traders can adapt swiftly to changing market conditions. By focusing on volume trends and key news events, you can better gauge whether a triangle is likely to succeed or fail, regardless of the underlying asset.
Whether you’re analysing a currency pair’s response to economic reports or monitoring index fluctuations, the versatility of ascending triangle patterns remains a valuable aspect of any chart-based trading strategy. However, as always, it is important to combine multiple indicators and maintain prudent risk management to mitigate the effect of false or failed breakouts.
The ascending triangle is a powerful tool in a trader’s arsenal, but even the most reliable patterns can fail. Understanding its formation, recognising the signs of a failed breakout, and adapting your strategy accordingly are essential skills for navigating the complexities of financial markets.
Ready to refine your trading skills? Explore PU Prime’s advanced charting tools with a demo account to practise identifying ascending triangles and their variations.
A failed ascending triangle typically signals a shift in market sentiment. Instead of breaking above the resistance level, the price reverses and breaks below the rising support line, often leading to a bearish reversal or extended consolidation. This failure suggests that buyers lost momentum, and sellers regained control.
Traders often adjust their strategies when a pattern fails. For example, they may initiate short positions if the price breaks below the ascending support line or wait for new patterns to emerge before committing capital. The key is to monitor volume and momentum indicators to confirm the breakdown and avoid trading on false signals.
Yes, it’s possible for a failed pattern to recover if market conditions improve or new buying pressure emerges. However, traders should wait for clear confirmation of a bullish breakout before re-entering a long position.
To minimise risk, always confirm breakouts or breakdowns with volume and use stop-loss orders to cap potential losses. Additionally, combining ascending triangle analysis with complementary indicators like RSI or MACD can provide more reliable signals.
No, while ascending triangles are often associated with bullish trends, they can also appear in bearish markets as a reversal pattern. The direction of the breakout (up or down) depends on the prevailing trend and market conditions.
Step into the world of trading with confidence today. Open a free PU Prime live CFD trading account now to experience real-time market action, or refine your strategies risk-free with our demo account.
This content is for educational and informational purposes only and should not be considered investment advice, a personal recommendation, or an offer to buy or sell any financial instruments.
This material has been prepared without considering any individual investment objectives, financial situations. Any references to past performance of a financial instrument, index, or investment product are not indicative of future results.
PU Prime makes no representation as to the accuracy or completeness of this content and accepts no liability for any loss or damage arising from reliance on the information provided. Trading involves risk, and you should carefully consider your investment objectives and risk tolerance before making any trading decisions. Never invest more than you can afford to lose.

Trade forex, indices, metal, and more at industry-low spreads and lightning-fast execution.
Sign up for a PU Prime Live Account with our hassle-free process.
Effortlessly fund your account with a wide range of channels and accepted currencies.
Access hundreds of instruments under market-leading trading conditions.
Trading Platforms
Learn
About PU Prime
Corporate

Please note the Website is intended for individuals residing in jurisdictions where accessing the Website is permitted by law.
Please note that PU Prime and its affiliated entities are neither established nor operating in your home jurisdiction.
By clicking the "Acknowledge" button, you confirm that you are entering this website solely based on your initiative and not as a result of any specific marketing outreach. You wish to obtain information from this website which is provided on reverse solicitation in accordance with the laws of your home jurisdiction.
Thank You for Your Acknowledgement!
Ten en cuenta que el sitio web está destinado a personas que residen en jurisdicciones donde el acceso al sitio web está permitido por la ley.
Ten en cuenta que PU Prime y sus entidades afiliadas no están establecidas ni operan en tu jurisdicción de origen.
Al hacer clic en el botón "Aceptar", confirmas que estás ingresando a este sitio web por tu propia iniciativa y no como resultado de ningún esfuerzo de marketing específico. Deseas obtener información de este sitio web que se proporciona mediante solicitud inversa de acuerdo con las leyes de tu jurisdicción de origen.
Thank You for Your Acknowledgement!
20 February 2025,08:13
IntermediateTechnical Analysis
20 February 2025, 08:13
Chart patterns play a pivotal role in technical analysis, offering traders a visual framework for identifying potential market momentum shifts. Among the many patterns tracked by analysts, the ascending triangle is especially noteworthy for indicating a likely continuation of bullish trends. Yet, despite its strong reputation, the pattern does not always behave as expected. When breakouts fail to materialise or quickly reverse, traders are confronted with a failed ascending triangle pattern. This is a scenario that can carry important implications for future price action.
Understanding the dynamics of both successful and failed ascending triangles is essential for traders aiming to navigate the complexities of today’s financial markets. By recognising these patterns and their variations, traders can make informed decisions, manage risk effectively, and adapt their strategies to changing conditions.
An ascending triangle is a commonly recognised chart formation in technical analysis that typically indicates a bullish continuation. It forms when a market’s price action creates a horizontal resistance line at the top and a rising trendline underneath. Each time price nears the top boundary, it struggles to break higher but retreats to a higher low creating the characteristic ascending support line.
Ascending triangles are classed as a continuation pattern. In an established uptrend, the pattern often signals strong upside momentum if price eventually closes above the horizontal resistance on higher-than-usual volume. Traders watch for this breakout, interpreting it as a sign that buyers have overcome the selling pressure at the resistance line.However, like all technical patterns, ascending triangles are not foolproof. A seemingly perfect formation can result in a failed ascending triangle pattern if price fails to break above resistance or if the breakout lacks follow-through.
Despite the ascending triangle’s reputation as a reliable continuation pattern, it can still break down in unexpected ways. In a failed ascending triangle pattern, the anticipated bullish breakout never fully materialises, or if it does, it quickly reverses. Several factors can contribute to this scenario:
By recognising these triggers, traders can better prepare for potential downside scenarios.
The ascending triangle pattern is more than just a technical formation on a chart—it represents a battle between buyers and sellers and reveals important clues about market psychology.
As the price forms higher lows, it reflects increasing confidence among buyers. Each time the price pulls back, buyers are willing to step in earlier, believing the asset is undervalued at progressively higher levels.
This behaviour creates the upward-sloping trendline that underpins the ascending triangle, signalling growing demand and optimism.
The horizontal resistance line shows that sellers remain active at a specific price level, preventing the market from breaking higher. This resistance often represents a psychological barrier, such as a prior high, where many traders anticipate a reversal.
Sellers’ resolve can weaken over time if buying pressure intensifies, leading to the eventual breakout.
As the pattern progresses, the space between the resistance line and the rising trendline narrows, creating tension. This reflects a build-up of momentum as buyers and sellers prepare for a decisive move.
The final breakout (or breakdown) is often explosive, as one side dominates and the price reacts accordingly.
When an ascending triangle fails, it often indicates a shift in sentiment. Buyers may lose confidence due to external factors like negative news or weak volume, causing the pattern to collapse.
Conversely, sellers may reassert control if the resistance level is perceived as too strong, leading to a breakdown instead of a breakout.
Spotting an ascending triangle on a price chart requires careful observation of both horizontal resistance and rising support.
Imagine a major commodity such as gold trading near a long-term resistance level of £1,900 per ounce. Over several weeks, gold’s price fails to surpass this threshold, creating a horizontal line of resistance. Meanwhile, the low points of each consolidation are forming ever-higher troughs—£1,850, then £1,870, and so on—indicating increasing buying interest. Charting these higher lows reveals a rising support line, producing a classic ascending triangle formation.
Using trading programs, it is possible to track historical price data and overlay technical indicators to confirm whether volume and momentum align with a potential breakout. By identifying these key elements, traders gain better insight into the likelihood of a sustained bullish move.
A failed ascending triangle occurs when the anticipated bullish breakout either does not materialise or quickly reverses course. Recognising the tell-tale signs of a failure is crucial for traders aiming to avoid unnecessary losses and adapt their strategies promptly.
Consider a forex pair like GBP/USD forming an ascending triangle with a horizontal resistance around 1.3100. After several failed attempts to close above 1.3100, the pair briefly rallies to 1.3120 on lacklustre volume. Soon after, it plummets back below 1.3100 and breaches its rising trendline around 1.3050. The move is accompanied by a surge in selling volume, confirming a failed ascending triangle.
Using a platform like PU Prime, traders can overlay volume indicators and use real-time price alerts to spot such false breakouts in progress. By identifying the abrupt drop below the support line or the rapid return under resistance, traders gain a strong signal that the previously bullish scenario is no longer valid.
When an ascending triangle fails, the consequences for market sentiment and price direction can be significant. Rather than continuing to trend higher, the failed breakout or sudden breakdown often signals a shift in control from buyers to sellers.
Utilising comprehensive platforms, such as those offered by PU Prime, allows traders to quickly recognise a shift in momentum. By setting price alerts, monitoring real-time volume data, and using customisable charting tools, traders can better interpret whether a failed ascending triangle is likely to lead to a full-fledged downtrend or a drawn-out consolidation phase.
Even though ascending triangles are often seen as bullish continuation patterns, it is important to have strategies in place for both successful and failed breakouts.
Regardless of whether the ascending triangle meets or defies expectations, risk management is paramount. Tools that offer stop-loss settings, advanced charting features, and real-time volume data allow traders to monitor the market more effectively. Focus on keeping a clear head and well-defined rules for entering and exiting trades. This is especially the case in volatile conditions where sentiment can flip rapidly.
While ascending triangles can provide valuable insights, relying on this single chart pattern carries inherent risks. A comprehensive trading approach requires awareness of the potential pitfalls:
Traders can benefit from advanced charting tools to cross-verify potential breakout scenarios. Features like multiple chart overlays and technical studies help confirm whether an ascending triangle aligns with broader market signals. By combining various indicators and carefully managing your position size, you can guard against the inherent limitations of relying on a single pattern.
Ascending triangle patterns, including their failed variations, occur in multiple asset classes. Their core principles (horizontal resistance, rising support, and the potential for a breakout) apply whether you’re trading forex, stock indices, commodities, or other instruments.
Because PU Prime enables the trading of CFDs across a range of global markets (forex, indices, commodities, and shares) the ascending triangle pattern (and its potential failure) can be applied consistently. With real-time data, customisable chart overlays, and advanced analytical tools, traders can adapt swiftly to changing market conditions. By focusing on volume trends and key news events, you can better gauge whether a triangle is likely to succeed or fail, regardless of the underlying asset.
Whether you’re analysing a currency pair’s response to economic reports or monitoring index fluctuations, the versatility of ascending triangle patterns remains a valuable aspect of any chart-based trading strategy. However, as always, it is important to combine multiple indicators and maintain prudent risk management to mitigate the effect of false or failed breakouts.
The ascending triangle is a powerful tool in a trader’s arsenal, but even the most reliable patterns can fail. Understanding its formation, recognising the signs of a failed breakout, and adapting your strategy accordingly are essential skills for navigating the complexities of financial markets.
Ready to refine your trading skills? Explore PU Prime’s advanced charting tools with a demo account to practise identifying ascending triangles and their variations.
A failed ascending triangle typically signals a shift in market sentiment. Instead of breaking above the resistance level, the price reverses and breaks below the rising support line, often leading to a bearish reversal or extended consolidation. This failure suggests that buyers lost momentum, and sellers regained control.
Traders often adjust their strategies when a pattern fails. For example, they may initiate short positions if the price breaks below the ascending support line or wait for new patterns to emerge before committing capital. The key is to monitor volume and momentum indicators to confirm the breakdown and avoid trading on false signals.
Yes, it’s possible for a failed pattern to recover if market conditions improve or new buying pressure emerges. However, traders should wait for clear confirmation of a bullish breakout before re-entering a long position.
To minimise risk, always confirm breakouts or breakdowns with volume and use stop-loss orders to cap potential losses. Additionally, combining ascending triangle analysis with complementary indicators like RSI or MACD can provide more reliable signals.
No, while ascending triangles are often associated with bullish trends, they can also appear in bearish markets as a reversal pattern. The direction of the breakout (up or down) depends on the prevailing trend and market conditions.
Trade forex, indices, metal, and more at industry-low spreads and lightning-fast execution.
Sign up for a PU Prime Live Account with our hassle-free process.
Effortlessly fund your account with a wide range of channels and accepted currencies.
Access hundreds of instruments under market-leading trading conditions.
Sign up for a PU Prime Live Account with our hassle-free process.
Effortlessly fund your account with a wide range of channels and accepted currencies.
Access hundreds of instruments under market-leading trading conditions.