PU Prime App
Exclusive deals on mobile


PU Prime App
Exclusive deals on mobile


Hold The Global Markets In Your Hands
Our trading mobile app is compatible with most smart devices. Download the App now and start trading with PU Prime on any device, anytime and anywhere.

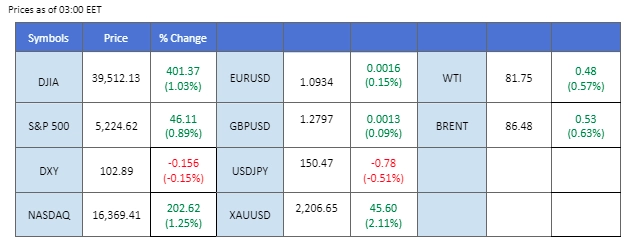
The Federal Reserve announced its decision to maintain interest rates in the range of 5.25% to 5.50%, consistent with market expectations. However, Fed Chair Jerome Powell’s subsequent dovish statement indicated a commitment to rate cuts later this year, despite recent signs of inflationary pressure, as evidenced by last week’s Producer Price Index (PPI) reading. This dovish stance exerted downward pressure on the dollar index (DXY), which declined by as much as 0.6%, while simultaneously propelling gold prices to a peak of $2222.90. Geopolitical uncertainties, particularly in regions such as Russia and Israel, combined with Japan’s recent rate hike, have contributed to heightened market risk and bolstered demand for gold as a safe-haven asset.
Meanwhile, oil prices experienced an uptick following the release of the American Petroleum Institute (API) crude inventories data, which revealed a significant decline in stockpiles. This positive data pushed oil prices towards the $84 mark. Additionally, the Japanese Yen strengthened for the first time in eight days as investors assessed the potential interest rate divergence between Japan and the United States.
Current rate hike bets on 1st May Fed interest rate decision:
Source: CME Fedwatch Tool
0 bps (90.0%) VS -25 bps (10%)

(MT4 System Time)

Source: MQL5

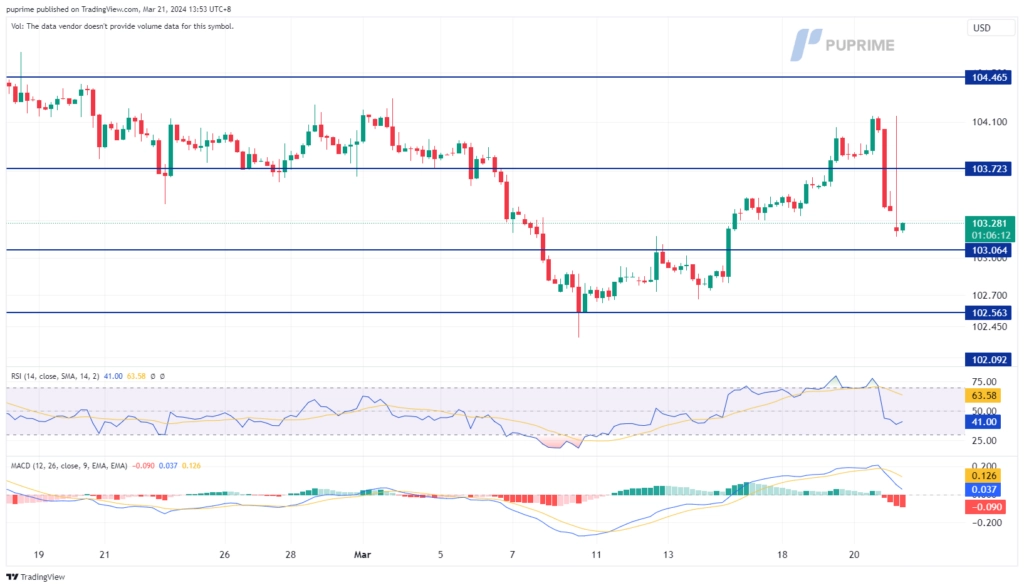
The Dollar Index witnessed a significant downturn as the Federal Reserve reaffirmed its commitment to maintaining a dovish monetary policy stance, contrary to market expectations. Fed Chair Jerome Powell’s emphasis on the necessity of further economic data before considering any rate adjustments prompted investors to engage in profit-taking activities. All eyes now turn to forthcoming monetary policy decisions as analysts recalibrate their rate cut projections in response to the Fed’s cautious approach.
The Dollar Index is trading lower while currently testing the support level. MACD has illustrated increasing bearish momentum, while RSI is at 38, suggesting the index might extend its losses after breakout below the support level.
Resistance level: 103.70, 104.45
Support level:103.05, 102.55
Gold prices experienced a sharp upturn following the Federal Reserve’s reiteration of its intention to implement rate cuts throughout 2024, despite recent inflationary pressures. Fed officials underscored their view of current inflation levels as manageable and outlined a roadmap for further rate reductions totalling 100 basis points over the next two years. This dovish stance led to a decline in US Treasury yields, spurring heightened demand for gold as investors sought to hedge against potential currency devaluation.
Gold prices are trading higher following the prior breakout above the previous resistance level. However, MACD has illustrated diminishing bullish momentum, while RSI is at 76, suggesting the commodity might enter overbought territory.
Resistance level: 2235.00, 2250.00
Support level: 2150.00, 2080.00
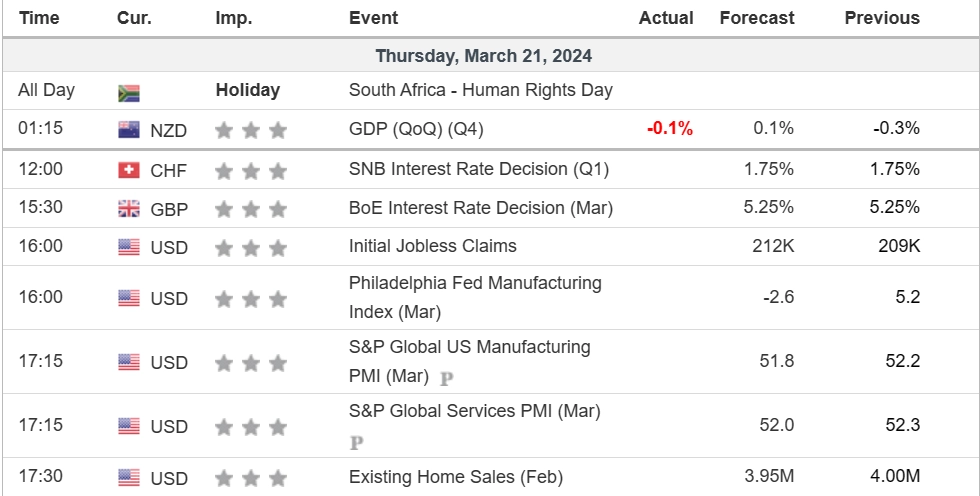
The GBP/USD pair saw a robust rebound, driven primarily by a weakening dollar following the Federal Reserve’s interest rate decision. Initially, the Sterling faced downward pressure following a disappointing UK Consumer Price Index (CPI) report. However, it later rallied strongly in response to a dovish statement from the Federal Reserve, which underscored the U.S. central bank’s intention to cut rates within the year, placing downward pressure on the dollar.
GBP/USD recorded a rebound from its support level at near 1.2700 levels, suggesting a trend reversal signal for the pair. The RSI rebounded sharply to near the overbought zone while the MACD crossed above the zero line, suggesting a bullish momentum is forming.
Resistance level: 1.2880, 1.2940
Support level: 1.2770, 1.2700
The EUR/USD pair has experienced a notable rebound from its March lows, indicating a potential trend reversal. This sharp rise comes as the U.S. dollar weakened significantly following dovish remarks from the Federal Reserve’s Chair, which hinted at a forthcoming rate cut within the year despite persistent inflation concerns in the U.S. Additionally, the forthcoming release of the Eurozone’s Purchasing Managers’ Index (PMI) data today is anticipated to further influence the pair’s movement.
EUR/USD rebounded sharply and is approaching its recent high at 1.0955. The RSI rebounded sharply to near the overbought zone, while the MACD has broken above the zero line, suggesting bullish momentum has formed.
Resistance level: 1.0960, 1.1040
Support level: 1.0866, 1.0775
The Japanese yen saw a robust rally as the Federal Reserve restated its commitment to future rate cuts extending into 2024, prompting a decline in US Treasury yields. With the yield differential between US and Japanese bonds narrowing, the appeal of carry trades diminished, prompting investors to redirect capital back into the yen. With market attention now centred on interest rate disparities, the yen’s upward trajectory may persist in the short term.
USD/JPY is trading lower following the prior breakout below the support level. MACD has illustrated increasing bearish momentum, while RSI is at 56, suggesting the pair might extend its losses since the RSI retreated sharply from overbought territory.
Resistance level: 150.80, 151.95
Support level: 149.35, 147.05
The AUD/USD pair recorded a significant rebound, surging over 1.50% in the previous session as the U.S. dollar encountered pronounced selling pressure. This downward trend in the U.S. dollar is largely attributed to a dovish stance taken by the Federal Reserve. Concurrently, the Australian dollar found additional support from robust job data out of Australia, with both employment change and the unemployment rate surpassing expectations, further strengthening its position against the U.S. dollar.
The AUD/USD pair rebounded sharply and is approaching its high at 0.6640. The RSI is on the brink of breaking into the overbought zone, while the MACD is breaking above the zero line, which suggests strong bullish momentum is forming.
Resistance level:0.6640, 0.6680
Support level: 0.6590, 0.6540
Crude oil prices initially faced downward pressure amidst heightened market uncertainty and risk aversion preceding the Federal Reserve’s policy announcement. However, a modest recovery ensued during early Asian trading hours following a dovish stance from the Fed and positive inventory data. Notably, Energy Information Administration (EIA) statistics revealed a larger-than-anticipated decline in US crude oil inventories, offering a supportive factor for oil prices amid ongoing market fluctuations.
Oil prices are trading higher following the prior rebound from the support level. MACD has illustrated diminishing bearish momentum, while RSI is at 53, suggesting the commodity might extend its gains toward resistance level since the RSI rebounded sharply from overbought territory.
Resistance level: 82.85, 84.10
Support level: 80.20, 78.00

Trade forex, indices, metal, and more at industry-low spreads and lightning-fast execution.
Sign up for a PU Prime Live Account with our hassle-free process.
Effortlessly fund your account with a wide range of channels and accepted currencies.
Access hundreds of instruments under market-leading trading conditions.
Please note the Website is intended for individuals residing in jurisdictions where accessing the Website is permitted by law.
Please note that PU Prime and its affiliated entities are neither established nor operating in your home jurisdiction.
By clicking the "Acknowledge" button, you confirm that you are entering this website solely based on your initiative and not as a result of any specific marketing outreach. You wish to obtain information from this website which is provided on reverse solicitation in accordance with the laws of your home jurisdiction.
Thank You for Your Acknowledgement!
Ten en cuenta que el sitio web está destinado a personas que residen en jurisdicciones donde el acceso al sitio web está permitido por la ley.
Ten en cuenta que PU Prime y sus entidades afiliadas no están establecidas ni operan en tu jurisdicción de origen.
Al hacer clic en el botón "Aceptar", confirmas que estás ingresando a este sitio web por tu propia iniciativa y no como resultado de ningún esfuerzo de marketing específico. Deseas obtener información de este sitio web que se proporciona mediante solicitud inversa de acuerdo con las leyes de tu jurisdicción de origen.
Thank You for Your Acknowledgement!